Ibrahim, A. D., & Umoru, K. (2026). Spatiotemporal Mapping and Analysis of the Land Use and Land Cover in Makurdi, Nigeria. International Journal of Research, 13(1), 278–286. https://doi.org/10.26643/ijr/2026/6
Daily writing prompt
Name an attraction or town close to home that you still haven’t got around to visiting.
This study employed geospatial techniques to capture the process of land conversion taking place. The objectives include mapping the land use types. The methodology involved geospatial technique which uses remote sensing and GIS techniques to identify the past and current condition of land use change occasioned development activities in the Makurdi Metropolis for the period of 1999, 2009 and 2019. The result shows that overall, there was progressive and increasing change in built-up area and water body categories, at (17.00%) and (1.73%) respectively during the period of study. However, vegetation cover, farm land, bare land and wetland decreased by (2.51%), (3.51%), (4.61%) and (8.08%) respectively. Residential buildings are fast encroaching the flood plain of River Benue in Makurdi. There is a need to sensitize the residents on the danger of flooding and provisions should be made to relocate those already occupying the location.
Keywords:GIS, land use change, Imagery, Mapping, remote sensing
Introduction
The population of the world is growing at different rates relative to the total population (Omali, 2020), and it is becoming more urbanized (Enoch, John, and Jonathan, 2020). Changes in land use and land cover (LULC), which are more common in developing countries, are a result of this population growth. Due to the “push” of rural areas and the “pull” of urban centers, Nigeria’s high rate of urbanization is changing its land use (Aluko, 2013). Unprecedented alterations in the ecosystem and environmental processes have, of course, been brought about by natural forces and human activity (Okeke and Omali, 2016). This has resulted in a decline in biodiversity and environmental degradation. Land use and cover change is a global phenomenon. While urban centers are growing in population and area the surrounding open/agricultural lands are rapidly changing. Construction is putting increasing pressure on the land use to make room for a variety of urban land uses. There are severe consequences from the ruthless reduction of available land per person, including low or decreased food production, ecological degradation, environmental problems, and socioeconomic difficulties.
Current methods for managing natural resources and keeping an eye on environmental changes heavily rely on studies on changes in land use and land cover (LULC) (Okeke and Omali, 2016). This makes it feasible to comprehend human interactions with natural resources, both past and present, as well as their effects. To get the desired outcome, the conventional approach to LULC assessment is inadequate (Okeke and Omali, 2018). Therefore, it’s critical to use cutting-edge technologies, such as sophisticated computers, remote sensing, geographic information systems (GIS), GPS, and the power of spatial information systems (Okeke and Omali, 2016). Since remote sensing is the only affordable technology that provides data on a global scale, it provides an important means of detecting and analyzing spatiotemporal dynamics on geographical entities (Omali, 2018a). Through the use of aerial or spaceborne sensors, remote sensing gathers data about Earth without requiring the sensors to come into direct physical contact with the target or object of interest (Omali, 2022a). According to Omali (2021) the electromagnetic radiation serves as the transmission medium for information. GIS is typically employed in the gathering, storing, modifying, analyzing, visualizing, and presenting of georeferenced data and information (Omali, 2022b). Through the manipulation, analysis, statistical application, and modeling of spatial data, it provides us with the ability to handle spatially referenced data (Omali, 2022c). In general, remote sensing data and GIS techniques have emerged as incredibly helpful tools for mapping natural resources, such as vegetation and changes in land use/cover over geographic areas. This has allowed for the removal of many of the constraints associated with traditional surveying techniques and the acquisition of a continuous and comprehensive ecosystem inventory. In light of this, research on the LULC in Makurdi was conducted using geospatial technologies over a 20-year period, from 2009 to 2019.
Methodology
Data
Both primary and secondary sources provided data for the study; some of these are listed in Tables 1a and 1b. Satellite imagery and field observations make up the main sources. During the field campaign, training site coordinates were recorded using a handheld GPS device (Garmin Etrex 32). With the GPS using satellite, almost anywhere on Earth can be located at any time (Omali, 2023a). Furthermore, it is important to note that time-series data, such as remotely sensed data from various eras, must be applied in order to study and monitor LULC (Omali, 2023b). As a result, the time-series satellite data from three epochs of multi-spectral Landsat TM/ETM/OLI imagery were used in this study. Other materials such as newspapers, journals, textbooks, World Bank publications, and maps are included in the secondary sources.
Table 1a: Maps used in the study
Type
Date of Production
Source
Scale
Landuse/landcover map
Secondary
1999
Military Air Force Base Makurd
1:1000000
A base map of Makurdi LGA
Secondary
2019
Benue State Ministry of Land and Survey
1:50000
Table 1b: Satellite imageries used in the study
Type
Path/Row
Date of Imagery
Source
Resolution
TM (Band 1-7)
Primary
188/55
July 5, 1999
Global Land Cover Facility (GLCF) database.
30m
ETM+(Band 1-7)
Primary
188/55
August 4, 2009
Global Land Cover Facility (GLCF) database.
30m
OLI+
Primary
188/55
July11, 2019
Global Land Cover Facility (GLCF) database.
30m
Pre-processing of the Satellite Imagery
It is crucial to pre-process satellite images for accurate change detection (Andualem et al., 2018). Time series analysis requires this crucial step in order to reduce noise and improve the interpretability of image data (Yichun et al., 2008). The processes and methods used in satellite image processing include geometric correction, atmospheric and radiometric correction, and masking study areas. To produce a consistent and trustworthy image database, radiometric and atmospheric correction is applied to account for variations in the viewing geometry and instrument response characteristics, as well as atmospheric conditions related to scene illumination. Pre-processing techniques used in this study included study area masking, image enhancement, and correction for atmospheric and radiometric errors. In order to bring the image scene and the scanned topographic maps into the same coordinate system, they were also co-registered into UTM zone 32N, WGS 84.
Image Classification
The goal of the imagery classification process was to assign each pixel in the digital image to one of many land cover classes, or “themes” (Omali, 2018b). This allows for the creation of thematic maps of the land cover present in an image. Finding the land use and land cover class of interest was the first stage in this study’s mapping and change analysis of land use and land cover. In this investigation, we employed six classes, as indicated in table 2, by incorporating and adapting the classification scheme from Andersen et al. (1971). The classes listed in Table 2 were utilized in this study. Also, the maximum likelihood supervised classification technique was used to classify LULC images from Landsat data. The study’s training sites were first located and defined. Fieldwork yielded training samples in line with Lu and Weng (2007). For the actual supervised classification of the study area, signature files containing statistical data about the reflectance values of the pixels within the training site for each of the LULC types or classes were developed in line Ojigi (2006). The supervised classification algorithm was imputed with the signatures.
Table 2: Land Use/Land Cover Classification Scheme
Land Use
Description
Built-up Area
comprises all developed surfaces including residential, commercial, industrial complexes, public and private institutions, recreational areas, Airport, Factories, Interstate highways, roads networks that linked most of the areas together.
Vegetation,
areas covered with plants of various species. This category includes grassland and non-agricultural trees and shrubs they are mostly wild plants.
Farm Land,
land used primarily for cultivation of food and fibre, it includes cropped areas, fallow land and plantations (Ochards, nursery, vineyard etc.), harvested areas and herbaceous croplands.
Bare Surface,
includes open surfaces, rocky outcrops, sandy area, strip mines, quarries, gravel pits, silt etc. Exposed soil devoid of vegetal cover, that is, open spaces.
Water body,
includes areas covered with water bodies such as rivers, streams, lakes, flood plain, Reservoirs. It also includes artificial impoundment of water like dam used for irrigation, flood control, municipal water supplies, recreation, etc.
Wetland.
an area where water covers the soil either at or near the surface of the soil all year or for varying periods of time during the year, including during the growing season.
Source: Adapted and modified from Anderson et al., (1971)
Land Use and Land Cover change Detection
There are numerous approaches for detecting changes in multi-spectral image data, such as time series analysis, vector analysis of spectral changes, and characteristic analysis of spectral type. Time series analysis is the most common method, and it was used in this study. Its objective is to analyze the course and trend of changes by tracking ground objects using continuous observation data from remote sensing (Adzandeh, et al., 2014). Naturally, post-classification comparisons can yield results of change that are acceptable and provide “from-to” data (Okeke and Omali, 2018).
Results and Discussion
Land Use and Land Cover Classification Result
The satellite imageries covering the study area were classified in GIS environment. Tables 2 reveal that there is a progressive and significant increase in built-up area which is necessitated by the increase in commercial activities, residential growth, economic and social activities. This is in line with the findings of Etim and Dukiya (2013) who opine that urban encroachment on agricultural land has reduced the productivity of most farmers in Makurdi. The water body recorded little increase due to the increase in water works like construction of Kaptai Lake, which is the largest artificial lake in the country. The farm land, vegetation, bare land and wetland decreases throughout the period of study.
Table 3: Land use and land cover distribution of Makurdi
Class
1999
2009
2019
Area (km2)
(%)
Area (km2)
(%)
Area (km2)
(%)
Built-up
98.079
11.97
170.968
20.86
237.46
28.97
Vegetation
138.20
16.86
125.695
15.33
117.653
14.35
Farm Land
203.56
24.83
184.608
22.52
174.735
21.32
Bare Land
142.487
17.38
122.249
14.91
104.561
12.77
Water Body
22.459
02.74
29.164
03.56
36.658
04.47
Wetland
214.89
26.22
186.99
22.78
148.696
18.14
Total
819.670
100
819.670
100
819.670
100
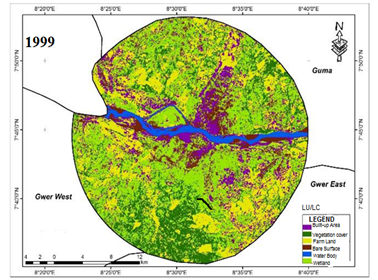
The classified images (false colour composite) for the different periods 1999, 2009 and 2019 of study area are shown in Figures 5.1, 5.2 and 5.3 respectively. These colour composite shows the visual distribution pattern of the distribution and change taking place in the images of the areas throughout the period of study. The dominating land use and land cover category in 1999 as shown in Table 3 and figure 1 is the wetland covering an area of 214.89km2 (26.22%). This is understandable as Hemba, et al. (2017) describes the relief of Makurdi town as lying entirely in the low- laying flood Plain with River Benue forming the major drainage channel. Farm land covers 203.56km2 representing 24.83% of Makurdi.
Figure 1: Land Use and Land Cover of Makurdi in 1999
Most residents engage in farming, either crop production or livestock farming as the soil is fertile and the weather is conducive for agricultural practices. This assertion supports the views of Hula, (2010) who noted that most farmers in Makurdi cultivate land for crop production, rearing of animals for consumption and selling part of the produce to generate money to meet other needs. The populace of Makurdi comprises of indigenous farmers and migrants who are mostly engaged in farm activities as noted by Oju et al. (2011). Due to farming and hunting and other activities like sand mining carried out in Makurdi, the size of bare land is observed to occupy large space of about 142.487km2 represented by 17.38% in 1999. This is because farmers have enough space to cultivate. Farmers relocate to other lands whenever a particular land becomes unproductive and this has been the major cause of bare land in the study area. These contradicts Tee (2019) who argued that hunting, grazing and other factors, which lead to clearing of land through manual, mechanical and chemical means have greatly changed the original vegetation cover to bare land and other classes of land use in Makurdi. The vegetation covered a reasonable size of land and it was 138.20km2 (16.86%).This is attributed to the few number of settlers in Maukurdi and low level of human activities taking place within the urban centre as at the time. The water body was 22.459 km2 (2.74%) with River Benue forming the major drainage system in the area and is the main source of water for human use. This is in line with the views of Nnule and Ujoh, (2017) who pointed out that Benue River is the main source of water in Makurdi. This doesn’t mean that other form of water sources like borehole, ponds and dams are not important.
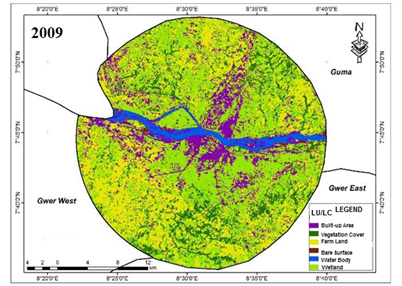
Table 1 and figure 2 shows that the wetland had the largest area coverage of about 186.99km2 (22.78%) in 2009 as the entire land fall within the Benue Valley and Trough. The geology of the study area influence the wetland, this infect is also confirmed by Iorliam, (2014). The farmland occupies 184.608km2 (22.52%), as most residents are farmers. The number is significant as civil
Figure 2: Land Use and Land Cover of Makurdi in 2009.
servants also own farms. The built-up, which was 170.968km2 (20.86%) recorded a high increase due the increase in population. This corroborates the findings of Jiang, et al. (2013) which stated that the urban expansion on agricultural land is associated with both shrinking agricultural land area and a higher level of urban development. It also agrees with the findings of Araya and Cabral (2010) that substantial growth of urban areas has occurred worldwide in the last few decades with population increase being one of the most obvious agents responsible. The vegetation cover depreciated to 125.695km2 (15.33%). This may be attributed to deforestation as more forest was cleared to provide more space for increasing human development. This is buttressed by Mugish and Nyandwi (2015) that housing development on arable farm land in most cities has become an issue on the global agenda in recent times. Bare land, which was 122.52km2 (14.91%) decreased as the spaces were being covered with more structures but the water body 29.164km2 (3.56%) slightly increased. Of course, this is an indication that most of the human activities use water and other sources of water are being developed to meet the need of the increasing populace.
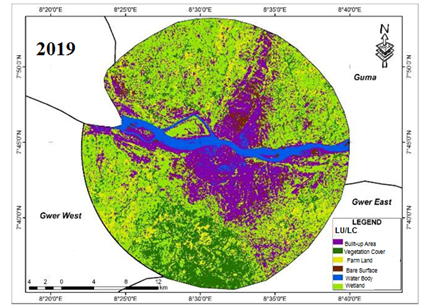
The level of human activities in the year 2019 was very high, although Makurdi has no functional Master Plan to check the developmental activities, however, as shown in the image Fig5.3 and Table5.1, The built-up area of 237.46km2 (28.97%) in 2019 almost tripled its size recorded in 1999.This supports the assertion by United Nations Department of Economy and Social Affairs (UNDESA, 2010) that urban cities have changed from small isolated population
Figure 3: Land Use and Land Cover of Makurdi in 2019.
centres to large interconnected economic, physical, and environmental features. In recent time, issues of Herdsmen/Farmers crisis are among factors contributing to the migration of people from neighbouring villages to Makurdi Town for safety. These numbers of people who mostly settled along the urban hinterland, which is mostly used for agricultural purpose, have converted the land for building of houses and other socioeconomic infrastructures. The farm land occupies 174.735km2 (21.32%) as it decreases with population upsurge settles in the study area. Farmers move outside of Makurdi to get land for their activities which make the cost of cultivation expensive than expected. Agencies with the mandate of protecting natural ecosystem are weak in areas of law enforcement in Makurdi as infrastructural developments are indiscriminately carried out. This observation contradicts the views of Wade quoted in Nico et al. (2000) that Various NGOs, government and international Agencies have been supporting the urban agriculture (UA) since 1970s in major world regions. There was reduction in wetland to 148.696km2 (18.14%) and vegetation cover to 117.653km2 (14.35%) compared to the previous ten years while the water body 36.658km2(4.47%) increases during the same periods.
Conclusion
The research findings revealed that built-up area increased all through the period of study while arable land decreases due to infrastructural development. The rapid increase in built-up area is because the surrounding agricultural land is fast decreasing. Bare land, vegetation and wetland decreased throughout the period of study as human settlement increases over the years. Of course, it was observed that the effect of the development was concentrated more to the north eastern part of Makurdi as residential buildings with high rate of economic activities is observed in the region. Generally, this study has been able to show that conversion of open/agricultural land for infrastructural development was mostly due to increase in number of people through migration and natural means of population growth. The land use and land cover change detection for the period of 20 years revealed the extent and type of conversion. The study recommends Green areas within and around the city should be properly preserved as this allows for ventilation. All effort should be put in place to prevent unofficial development and measures should be in place to curb population growth which has encouraged urban sprawl on prime agricultural land as this is feasible around Makurdi hinterland.
References
Aluko, O. (2011). Sustainable Housing Development and Functionality of Planning Laws in Nigeria: The case of Cosmopolitan Lagos. Journal of Sustainable Development, 4(5), 139–150.
Anderson, J. R. (1971). Land use classification schemes used in selected recent geographic applications of remote sensing: Photogramm. Eng., v. 37, no. 4, p. 379–387.
Adzandeh, E. A.; O. O. Fabiyi and Y. A. Bello. (2014). Statistical Analysis of Urban Growth in Kano Metropolis, Nigeria. International Journal of Environmental Monitoring and Analysis.2 (1): 50–56
Araya, Y. H. and Cabral, P. (2010).Analysis and Modeling of Urban Land Cover Change in Setúbal and Sesimbra, Portugal. Remote Sensing, 2: 1549–1563
Enoch, T. I.; T. S. John and I. A. Jonathan. (2020). Spatial Expansion of Urban Activities and Agricultural Land Encroachment in Makudi Metropolis: European Journal of Environment and Earth Science, 2684–446X
Etim, N. E. and J. J. Dukiya. (2013). GIS Analysis of Peri–Urban Agricultural Land Encroachment in (FCT), Nigeria. International Journal of Advanced Remote Sensing and GIS, 2(1): 303–315.
Hemba, S.; T. Enoch. l. Orimoleye and P. Dam. (2017). Analysis of the Physical Growth and Expansion of Makurdi Town. Imperial Journal of Interdisciplinary Research.3(4).
Hula, M. A. (2010). Population Dynamics and Vegetation Change in Benue State, Nigeria. Journal of Environmental Issues and Agriculture in Developing Countries, 2(1), pp53.
Iorliam, T. S. (2014). The Dialectics between Physical Plans and Physical Development in Contemporary Urban Nigeria: Empirical Evidence from the Kighir-Adeke Layout, Makurdi, Nigeria. Academic Research International Vol. 5(4).
Jiang, L; X. Deng and K. Seto. (2013). The Impact of Urban Expansion on Agricultural Land Use intensity in China. Land Use Policy, 35: 33–39.
Lu, D. and Q. Weng, (2007). A Survey of Image Classification Methods and Techniques for Improving Classification Performance. International Journal of Remote Sensing, vol. 28, pp. 823–870.
Mugish, J. and E. Nyandwi. (2015). Kigali City Peri-Urbanization and its Implications on Peri-Urban Land Use Dynamics: Cases of Muyumbu and Nyakaliro. GeoTechRwanda 2015– Kigali
Ojigi, L. M. (2006). Analysis of Spatial Variations of Abuja Land Use and Land Cover From Image Classification Algorithms,’’ ISPRS Commission VII Mid–Term Symposium, 8 – 11th May 2006, Enschede, The Netherlands (Conference proceedings).
Okeke, F. I. and T. U. Omali. (2016). Spatio-temporal Evaluation of Forest Reserves in the Eastern Region of Kogi State using Geospatial Technology. Tropical Environment, 13(1): 75–88.
Okeke, F. I., and T. U. Omali. (2018). Monitoring Deforestation and Forest Degradation in Yankari Games Reserve of Bauchi, Nigeria. Presentation at NIS AGM/Conference Bauchi, 2018. 18th June–22nd June, 2018
Omali, T. U. (2018a). Prospects of satellite–Enhanced Forest Monitoring for Nigeria. International Journal of Scientific & Engineering Research, 9(5), 383–388.
Omali, T. U. (2018b). Impacts of Sensor Spatial Resolution on Remote Sensing Image Classification. Global Scientific Journal, 6(1), 63–68.
Omali, T. U. (2020). Ecological Evaluation of Urban Heat Island Impacts in Abuja Municipal Area of FCT Abuja, Nigeria. World Academics Journal of Engineering Sciences, 7(1): 66–72.
Omali, T. U. (2021). Utilization of Remote Sensing and GIS in Geology and Mining. International Journal of Scientific Research in Multidisciplinary Studies, 7(4): 17–24.
Omali, T. U. (2022a). Monitoring the Ecological Component of Sustainable Development Goals using Geospatial Information Tools: A Review. International Journal of Scientific Research in Biological Sciences, 9(1): 92–99.
Omali, T. U. (2022b). Correlation of Geographic Information System with the Evolutionary Theory of Spatial Analysis. International Journal of Scientific Research in Computer Science and Engineering, 10(4): 18–22.
Omali, T. U. (2023a). Time-series Analysis of Vegetation Cover in the Southwest Nigeria using Remote Sensing and GIS. International Journal of Scientific Research in Multidisciplinary Studies, 8(7): 36–42.
Omali, T. U. (2023b). Coordinate Transformation of GPS Measurement Results using the Cartesian-to-Ellipsoidal Transformation System. International Journal of Scientific Research in Mathematical and Statistical Sciences, 10(4): 09–13.
Tee, N. T., P. U., Ancha, and J. Asue. (2019). Evaluation of Fuel Wood Consumption and Implications on the Environment: Case Study of Makurdi area in Benue state, Nigeria. Journal of Applied Biosciences, 19:1041–1048.
Yichun X., S. Zongyao, and Y., Mei. (2008). Remote Sensing Imagery in Vegetation Mapping: A Review. J Plant Ecol., 1(1): 9–23.
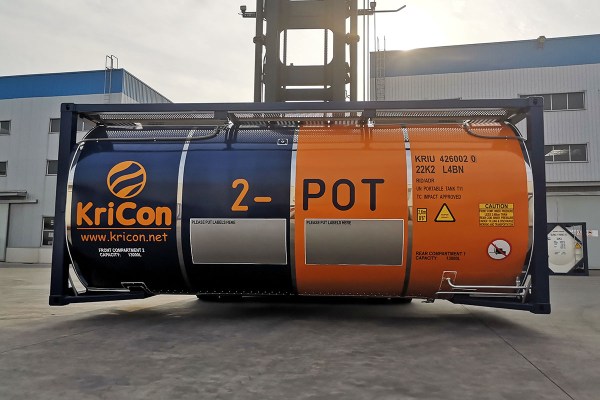
The transportation of isocyanates such as MDI (Methylene Diphenyl Diisocyanate) and TDI (Toluene Diisocyanate) remains one of the most demanding areas in chemical logistics. Strict safety requirements, temperature sensitivity, and regulatory oversight leave no room for compromise. In response to these challenges, Kricon Group has introduced a new generation of tank containers engineered specifically to meet the highest standards of safety, reliability, and operational efficiency.
According to an article on Logistics IT, Kricon Group has developed these ISOPA-certified tank containers to ensure safe and compliant transport of MDI and TDI across Europe and international markets, reinforcing its role as a trusted partner in chemical logistics.
Addressing the Complexities of Isocyanate Transport
MDI and TDI are critical raw materials for a wide range of industrial applications, including polyurethane foams, coatings, adhesives, and elastomers. However, their chemical properties make transportation particularly complex. These substances require precise temperature control, secure handling procedures, and equipment that fully complies with industry-specific standards such as those set by ISOPA (European Diisocyanate & Polyol Producers Association).
Any deviation from recommended transport conditions can pose risks to personnel, the environment, and supply chain continuity. As a result, logistics providers and chemical manufacturers increasingly seek purpose-built equipment rather than adapted or generic tank containers.
Designed in Full Compliance with ISOPA Guidelines
Kricon Group’s newly introduced tank containers are designed and manufactured in strict alignment with ISOPA recommendations. Compliance is not treated as a formality but as a core design principle that influences every aspect of the container’s construction.
The containers incorporate standardized connection points to ensure seamless compatibility with ISOPA-approved loading and unloading systems. Enhanced insulation supports stable temperature conditions throughout transit, while integrated safety features help reduce the risk of contamination, leakage, or operational error. These design choices support traceability and accountability at every stage of the logistics process.
By aligning container specifications with ISOPA standards from the outset, Kricon enables chemical producers and logistics partners to operate with greater confidence and regulatory assurance.
Engineering Solutions Tailored to MDI and TDI
Unlike general-purpose chemical containers, Kricon’s latest units are specifically engineered to meet the unique demands of isocyanate transport. Materials used in the construction are selected for their resistance to corrosion and chemical interaction, helping to preserve product integrity over long distances and repeated use cycles.
Temperature control options play a central role in the container design. Maintaining stable conditions is essential for preventing crystallization or degradation of MDI and TDI. The new containers can be equipped with advanced insulation systems and temperature management solutions that support consistent performance in varying climatic conditions.
In addition, intelligent monitoring technologies allow operators to track key parameters during transit. This data-driven approach improves visibility, enables early detection of potential issues, and supports continuous improvement in logistics planning.
Safety as a Strategic Priority
Safety is not limited to regulatory compliance; it is also a strategic differentiator in chemical logistics. Kricon Group’s investment in high-specification tank containers reflects a broader commitment to protecting people, cargo, and infrastructure.
Enhanced valve systems, reinforced structural components, and optimized design for handling operations reduce the likelihood of incidents during loading, transport, and unloading. These features are particularly valuable for logistics partners operating across multiple jurisdictions with varying regulatory expectations.
By prioritizing safety at the equipment level, Kricon helps its clients mitigate risk, reduce insurance exposure, and strengthen trust with downstream partners.
Supporting Efficiency and Sustainability
Beyond safety and compliance, the new generation of tank containers is designed to improve operational efficiency. Standardized specifications simplify fleet management, while durable construction supports long service life and reduced maintenance requirements.
Efficient thermal performance and optimized design also contribute to sustainability goals. By minimizing product loss, reducing the need for reprocessing, and supporting more predictable transport conditions, these containers help lower the environmental footprint associated with chemical logistics.
Sustainability considerations are increasingly important for chemical manufacturers facing pressure from regulators, investors, and customers alike. Equipment that supports both safety and environmental responsibility offers a clear competitive advantage.
Backed by a Global Logistics Network
Kricon Group’s tank container solutions are supported by its established global logistics network. This enables seamless deployment across key industrial regions and ensures that clients can access consistent equipment standards regardless of route or destination.
For manufacturers and distributors of isocyanates, this combination of specialized equipment and international logistics expertise simplifies coordination and reduces complexity in cross-border operations. It also supports scalability as demand grows or supply chains evolve.
Setting New Benchmarks in Chemical Transport
The introduction of ISOPA-certified tank containers for MDI and TDI transport underscores Kricon Group’s role in shaping best practices within the chemical logistics sector. Rather than responding reactively to regulatory change, the company is proactively investing in solutions that anticipate future requirements.
As chemical supply chains become more complex and expectations around safety, transparency, and sustainability continue to rise, purpose-built logistics equipment will play an increasingly central role. Kricon’s latest tank containers represent a step forward in aligning operational performance with industry standards and long-term strategic goals.
Conclusion
Transporting MDI and TDI safely is a challenge that demands specialized expertise, advanced engineering, and strict adherence to industry guidelines. Kricon Group’s new ISOPA-certified tank containers address these demands through thoughtful design, robust safety features, and a clear focus on compliance and efficiency.
For companies involved in the production, distribution, or logistics of isocyanates, these containers offer a reliable solution that supports both operational excellence and regulatory confidence. As chemical logistics continues to evolve, innovations of this kind will be essential in setting new standards for the industry.
AI adoption in U.S. transportation and logistics is shifting from experimentation to operational deployment, driven by cost pressure, capacity variability, customer expectations for transparency, and the growing availability of real-time operational data. In the auto transport segment (vehicle relocation, dealer moves, consumer shipping), platform-based models are accelerating adoption by standardizing data inputs (routes, vehicle types, availability), automating quoting and matching, and adding “control-tower” visibility across fragmented carrier networks. This article synthesizes recent research and industry reporting on AI in logistics and applies it to the U.S. auto transport market, highlighting practical use cases, common barriers (data quality, trust, integration), and what “responsible AI” looks like in platform settings.
1) Why AI is gaining traction in auto transport in 2026
The U.S. auto transport market sits at the intersection of trucking’s structural inefficiencies and consumer-grade expectations for instant information. Two dynamics matter:
Operational complexity and emissions pressure. Freight logistics is often cited as contributing roughly 7–8% of global greenhouse-gas emissions, and organizations like the World Economic Forum argue AI can reduce freight-logistics emissions through better planning and efficiency (e.g., route optimization, capacity utilization). While auto transport is a niche within freight, it inherits the same efficiency levers—empty miles, routing, and exception management.
A maturing AI adoption baseline. Broad cross-industry surveys suggest AI adoption has risen sharply (e.g., McKinsey’s reporting of adoption levels around the low-70% range in early 2024 across surveyed organizations). In transportation specifically, fleet/transport leadership surveys and trade reporting indicate growing AI usage—often concentrated in planning, route optimization, and operational efficiency—while simultaneously noting concern that the sector still lags other industries.
The implication: auto transport is adopting AI at a time when foundational digitization (tracking, electronic logs, more structured operational data) is already widespread.
2) The “platform perspective”: why platforms accelerate adoption
Auto transport has historically been broker-heavy and relationship-driven. Platforms change this by making the market more computable:
Structured workflows: digital inspections, status updates, exception handling.
This matters because modern AI (including machine learning and optimization) performs best when the system has consistent, high-quality inputs and feedback loops.
Example: Haulin.ai as an applied platform pattern
Haulin.ai publicly describes itself as an auto shipping platform that generates instant, transparent quotes using AI that analyzes real-time carrier availability and route optimization. From a platform-research lens, the useful (non-marketing) takeaways are:
Transparent pricing logic: platforms can reduce information asymmetry by presenting route-specific quotes up front rather than vague ranges.
Faster matching: algorithmic matching can shorten the “time-to-book” cycle, which is critical in markets where capacity changes daily.
Always-on support workflows: some platforms pair automation with continuous support coverage to reduce disruptions during pickup/delivery coordination.
These are not unique to one company; they represent common platform affordances that make AI adoption more viable in vehicle transport.
3) What AI is actually being used for in U.S. auto transport
AI adoption in auto transport clusters into six practical use cases:
A) Dynamic pricing and quote accuracy
Pricing in auto transport is sensitive to lane demand, seasonality, fuel, and carrier positioning. Platforms increasingly use models that incorporate real-time signals to reduce “quote drift” (quoted price vs booked price). Haulin.ai’s public explanation frames this as pricing informed by carrier availability, lane demand, and fuel trends to produce final quotes.
Research angle: algorithmic pricing reduces manual brokerage overhead, but also introduces governance needs (auditability, fairness, and guardrails).
B) Carrier matching and capacity utilization
A persistent freight problem is empty or underutilized miles (“deadhead”). Estimates vary widely; industry discussions commonly cite ranges (e.g., 15–35%) depending on fleet type and measurement method. In auto transport, deadhead shows up when a carrier must reposition to reach a pickup or return from a drop-off without a vehicle load. Matching algorithms attempt to reduce this by improving backhaul fit and route chaining.
C) Route optimization and ETA prediction
AI-enabled route planning integrates traffic, weather, and constraints (pickup windows, driver hours). In broader logistics, route optimization is routinely named among the top AI benefits by fleet executives. Even more important in consumer auto shipping is predictable ETAs and proactive alerts—an expectation increasingly treated as “standard” in many transport experiences.
D) Exception detection and “control tower” workflows
Delays (weather, mechanical issues, facility access problems) often dominate customer dissatisfaction. Modern logistics visibility emphasizes continuous monitoring and exception handling—detecting risk early and triggering human-in-the-loop actions. Platform architectures are naturally suited to implement exception management because they sit between shipper demand and carrier execution.
E) Compliance and operational telemetry
Trucking compliance digitization also underpins AI adoption. For example, FMCSA’s ELD requirements have driven standardization in logging data for many carriers, increasing the availability of structured operational signals (even if not directly used for consumer-facing tracking).
F) Customer communication (GenAI)
GenAI is being deployed in customer support across logistics to reduce response time and handle routine inquiries. Industry reporting points to “agentic” or AI-assisted support in freight settings as a growing trend. In auto transport, this typically translates into faster answers to: pickup scheduling, driver contact windows, ETA updates, and documentation questions.
4) What’s slowing adoption: four recurring barriers
Despite momentum, research and trade reporting consistently cite constraints:
1) Data quality and fragmentation
Logistics is multi-actor: shippers, brokers, carriers, terminals, and consumers. Reuters notes that AI’s real-world impact depends heavily on integration and high-quality data, and that siloed systems can block progress.
2) Trust, transparency, and perceived “black box” decisions
Algorithmic pricing and matching can be perceived as opaque. This is why transparent quote explanations (inputs, constraints, what changes the price) are becoming a functional requirement, not a marketing feature.
3) Talent and readiness gap
Even when organizations explore many AI use cases, fewer have the internal capability to scale them (skills, roadmaps, prioritized deployment). McKinsey’s distribution-focused analysis highlights this “explore vs scale” gap in adjacent sectors.
4) Security and governance concerns
U.S. transport/shipping professionals have reported hesitation tied to security and technical expertise constraints. In auto transport, personally identifiable information, addresses, and vehicle details elevate the importance of data governance.
5) A practical “platform maturity model” for AI in auto transport
From a platform standpoint, AI adoption tends to progress in phases:
Digitize the workflow (quotes, orders, dispatch, status updates)
Instrument the operation (tracking, structured events, inspection data)
The maturity model matters because many failures come from skipping steps 1–2 and expecting AI to compensate for missing or inconsistent data.
6) What “useful USPs” look like without marketing language
When evaluating a platform like Haulin.ai (or comparable systems) in research terms, the most defensible differentiators are operational:
Transparent, route-specific quoting that reduces price uncertainty for consumers.
Real-time carrier availability signals are used to improve booking realism (less “bait-and-switch” behavior in theory, if governed properly).
Workflow continuity: integrated scheduling + status updates + support reduces coordination friction, especially during exceptions.
These are best assessed with measurable KPIs (price variance, pickup punctuality, damage claims, and dispute rate), not adjectives.
7) Research implications and what to watch next
Three trends are likely to shape AI adoption in U.S. auto transport through 2026–2028:
Agentic operations: AI that doesn’t only “recommend” but can execute bounded actions (e.g., propose reroutes, suggest carrier swaps) with human approvals.
Decarbonization pressure: improving utilization and reducing empty miles becomes both an economic and sustainability lever—one of the clearest value cases for AI in freight-adjacent markets.
Conclusion
AI adoption in the U.S. auto transport market is best understood through a platform lens: platforms standardize inputs, unify fragmented actors, and create the data foundation that makes optimization and automation feasible. The most impactful near-term applications are dynamic pricing, carrier matching, route/ETA prediction, exception management, and AI-assisted communication—each dependent on data quality and governance. Haulin.ai provides a current example of how platform capabilities (transparent pricing, real-time availability analysis, and workflow support) can operationalize AI in consumer vehicle shipping without requiring the end-user to understand the underlying complexity.
Johnbull, E. U., Osuchukwu, N. C., & Omoniyi, A. E. (2026). Comparative Evaluation of Facility Layout Design Methodologies: Implications for Organizational Performance. International Journal of Research, 13(1), 213–218. https://doi.org/10.26643/ijr/2026/2
Egbukichi, Ugonna Johnbull1
Department of Industrial Safety and Bio-Environmental Engineering Technology. Federal College of land Resources Technology Owerri, Imo State
This study examines eight facility layouts and designs methodologies, including Systematic Layout Planning, Activity Relationship Chart, Space Relationship Diagram, Graph Theory, Simulation Modeling, Lean Layout Design, Sustainable Design and computer aided design. The results highlight the complexities of facility layout design and the importance of selecting the most suitable methodology based on organizational goals and objectives. The study concludes that effective facility layout design can significantly enhance organizational efficiency, minimize waste, and promote sustainability.
Facility layout and design refer to the strategic arrangement of physical resources, such as machinery, equipment, and workstations, within a production or service facility (Heragu, 2016). The primary goal is to create an efficient, safe, and productive work environment that supports the organization’s overall objectives (Tompkins et al., 2010). In highly competitive environments, effective facility layout plays a critical role in enhancing customer experience, improving workflow efficiency, and supporting employee responsiveness, all of which contribute to customer satisfaction and sustained patronage
3. Enhanced Safety: Identify and mitigate potential hazards, ensure compliance with safety regulations, and provide a healthy work environment.
4. Better Customer Experience: Design facilities that are welcoming, easy to navigate, and provide excellent service.
5. Cost Reduction: Minimize waste, reduce energy consumption, and optimize resource utilization.
1.2 Objectives
The objectives of facility layout and design include:
1. Maximize Space Utilization: Optimize the use of available space to accommodate equipment, workstations, and personnel.
2. Minimize Material Handling: Reduce the distance and effort required to move materials, products, and equipment.
3. Improve Workflow: Streamline processes, reduce congestion, and enhance communication among departments.
4. Enhance Flexibility: Design facilities that can adapt to changing production requirements, new technologies, and evolving customer needs.
5. Ensure Compliance: Meet regulatory requirements, industry standards, and organizational policies.
2.0 Literature review
Facility layout and design is a critical aspect of industrial production systems, as it directly impacts productivity, efficiency, and safety (Heragu, 2008). Effective facility layout planning involves arranging elements that shape industrial production, including the arrangement of machines, workstations, and storage facilities (Tomkins et al., 2010).
2.1 Key Components of Facility Layout Planning:
– Design Layout: The physical arrangement of facilities, including the location of machines, workstations, and storage facilities (Meller & Gau, 1996).
– Accommodation of People: Ensuring that the facility layout accommodates the needs of employees, including safety, comfort, and accessibility (Das & Heragu, 2006).
– Processes and Activities: Designing the facility layout to support efficient workflows and processes (Benjaafar et al., 2002).
Facility Layout Design Considerations:
– Plant location and design (Kumar et al., 2017)
– Structural design (Smith & Riera, 2015)
– Layout design (Drira et al., 2007)
– Handling systems design (Heragu, 2008)
– Risk assessment and mitigation (Taticchi et al., 2015)
2.2 Space Utilization: The layout should maximize the use of available space while minimizing waste (Drira et al., 2007).
2.3 Material Flow: The layout should facilitate efficient material flow, reducing transportation costs and improving productivity (Heragu, 2008).
2.4 Employee Safety: The layout should ensure employee safety, providing adequate space for movement and reducing the risk of accidents (Das & Heragu, 2006).
Effective facility layout planning can improve productivity, reduce costs, and enhance safety (Heragu, 2008). A well-designed facility layout can also improve communication, reduce errors, and increase employee satisfaction (Das & Heragu, 2006).
3.0 Methodologies and Tools
3.1 Systematic Layout Planning (SLP)
SLP is a structured approach to facility layout design, focusing on the relationship between departments and the flow of materials (Muther, 1973). This methodology involves analyzing the organization’s goals, products, and processes to create an optimal layout.
3.2 Activity Relationship Chart (ARC)
ARC is a graphical method used to analyze the relationships between different activities or departments within a facility (Muther, 1973). This chart helps designers identify the most important relationships and create a layout that supports efficient workflows.
3.3 Space Relationship Diagram (SRD)
SRD is a visual tool used to represent the relationships between different spaces or areas within a facility (Liggett, 2000). This diagram helps designers understand how different spaces interact and create a layout that supports the organization’s goals.
3.4 Graph Theory
Graph theory is a mathematical approach used to optimize facility layouts by representing the relationships between different nodes or departments (Tompkins et al., 2010). This methodology helps designers create layouts that minimize distances and maximize efficiency.
3.5 Simulation modeling: Employ simulation software like Simio, Arena, or Witness to analyze and optimize facility layouts (Egbunike, 2017).
3.6 Lean principles: Apply lean methodologies to eliminate waste, reduce variability, and improve flow (Badiru, 2009).
3.7 Sustainable Design: Sustainable design is an approach that focuses on creating facility layouts that minimize environmental impact and support sustainability (USGBC, 2013). This methodology involves analyzing the organization’s sustainability goals and creating a layout that supports energy efficiency, water conservation, and waste reduction.
3.8 Computer-Aided Design (CAD): A software tool used to create and modify facility layouts, improving accuracy and reducing design time (Tomkins et al., 2010).
4.0 Results
The study examined eight facility layouts and designs methodologies, including Systematic Layout Planning (SLP), Activity Relationship Chart (ARC), Space Relationship Diagram (SRD), Graph Theory, Simulation Modeling, Lean Layout Design, Sustainable Design and Computer Aided Design (CAD).
Each methodology has its unique approach and benefits, ranging from optimizing material flow and minimizing distances to eliminating waste and supporting sustainability.
4.1 Discussion
The results show that facility layout design is a complex task that requires careful consideration of various factors, including organizational goals, product and process requirements, and sustainability objectives. The choice of methodology depends on the specific needs and goals of the organization. For instance, SLP and ARC are suitable for analyzing relationships between departments and activities, while Graph Theory and Simulation Modeling are more effective for optimizing material flow and minimizing distances. Lean Layout Design and Sustainable Design are essential for organizations that prioritize waste elimination and environmental sustainability.
5.0 Conclusion
In conclusion, facility layout design is a critical aspect of organizational efficiency and effectiveness. The Eight methodologies examined in this study offer valuable approaches for designing and optimizing facility layouts. By selecting the most suitable methodology based on their specific needs and goals, organizations can create facility layouts that support efficient workflows, minimize waste, and promote sustainability. Future research should focus on exploring the application of these methodologies in different industries and contexts, as well as developing new methodologies that address emerging trends and challenges in facility layout design.
References
Apple, J. M. (1991). Material handling systems: Design, operation, and maintenance. McGraw-Hill.
Badiru, A. B. (2009). Handbook of industrial engineering equations, formulas, and calculations. CRC Press.
Banks, J., Carson, J. S., & Nelson, B. L. (2010). Discrete-event system simulation. Prentice Hall.
Benjaafar, S., Sheikhzadeh, M., & Gupta, D. (2002). Machine layout in manufacturing facilities. International Journal of Production Research, 40(7), 1449-1465.
Bitner, M. J. (1992). Servicescapes: The impact of physical surroundings on customers and employees. Journal of Marketing, 56(2), 57-71.
Das, S. K., & Heragu, S. S. (2006). A layered approach to facility layout design. International Journal of Production Research, 44(1), 147-166.
Drira, A., Pierreval, H., & Hajri-Gabouj, S. (2007). Facility layout design using ant colony optimization. International Journal of Production Research, 45(11), 2473-2493.
Egbunike, P. N. (2017). Facility layout design using simulation modeling. Journal of Engineering and Technology, 6(1), 1-10.
Hammer, M., & Champy, J. (1993). Reengineering the corporation: A manifesto for business revolution. HarperCollins.
Heragu, S. S. (2008). Facilities design. CRC Press.
Heragu, S. S. (2016). Facilities design. CRC Press.
International Organization for Standardization. (2015). ISO 9001:2015 Quality management systems — Requirements.
Jensen, J. B. (2017). Lean production and waste reduction. Journal of Cleaner Production, 142, 247-255.
Kotter, J. P. (2012). Leading change. Harvard Business Review Press.
Kulatilaka, N. (2017). Operations management: A focus on productivity. Journal of Operations Management, 49, 67-75.
Liggett, R. (2000). Space planning and layout. Journal of Facilities Management, 1(2), 131-144.
Meller, R. D., & Gau, K. Y. (1996). The facility layout problem: Recent and emerging trends and perspectives. Journal of Manufacturing Systems, 15(5), 351-366.
Muther, R. (1973). Systematic layout planning. Cahners Books.
Occupational Safety and Health Administration. (2020). Occupational Safety and Health Administration. Retrieved from https://www.osha.gov/
Oyedele, L. O. (2013). Computer-aided design of facility layouts. Journal of Engineering and Technology, 2(1), 1-8.
Smith, J. S., & Riera, B. (2015). Structural design of facilities. Journal of Building Engineering, 3, 144-153.
Sule, D. R. (2001). Manufacturing facilities: Location, planning, and design. PWS Publishing Company.
Taticchi, P., Tonelli, F., & Cagnazzo, L. (2015). Performance measurement and management: A literature review and a research agenda. International Journal of Production Research, 53(10), 3227-3245.
Tompkins, J. A., White, J. A., Bozer, Y. A., & Tanchoco, J. M. A. (2010). Facilities planning. John Wiley & Sons.
Okoye, J. N., & Nwokike, C. E. (2023). Service quality and consumer patronage in Roban Stores, Awka, Anambra State, Nigeria: Content analysis. Indonesian Marketing Journal, 3(2), 110–128.
U.S. Green Building Council. (2013). LEED v4 for building design and construction.
Womack, J. P., & Jones, D. T. (1996). Lean thinking: Banish waste and create wealth in your corporation. Simon and Schuster.
Stephen, A. O., Liu, C., & Xin, G. (2026). Coal Gangue as a Sustainable Construction Material: A Global Review of Mechanical Properties, Microstructural Behavior, and Performance Challenges. International Journal of Research, 13(1), 188–212. https://doi.org/10.26643/ijr/2026/1
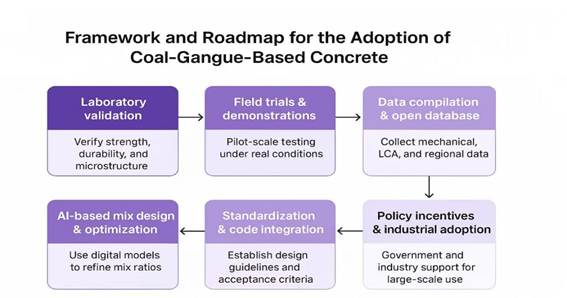
Coal gangue (CG), a substantial by-product of coal mining, has recently emerged as a promising sustainable material for concrete production. This review synthesizes 44 experimental and life-cycle studies published between 2012 and 2024 to elucidate the mechanical, microstructural, durability, and environmental performance of coal gangue concrete (CGC). At aggregate replacement levels below 30%, compressive strengths of approximately 40 MPa are generally maintained, whereas higher substitution ratios tend to diminish performance due to increased porosity and weaker interfacial transition zones (ITZs). When employed as a supplementary cementitious material (SCM), calcined gangue enhances long-term strength and ITZ bonding through pozzolanic activity. Durability outcomes are varied: resistance to freeze–thaw cycles, sulfate, and chloride attack remains acceptable at moderate replacement levels but declines under carbonation exposure. Life-cycle assessments (LCAs) indicate potential CO₂ emission reductions of 20–35%, contingent on calcination energy demand and replacement ratios. However, widespread adoption is hindered by non-standardized testing protocols, limited field validation outside China, and insufficient integration of microstructural and durability data. To address these challenges, this review proposes a four-layer evaluation framework (mechanical, microstructural, durability, and environmental), benchmark mix classifications for CGC, and a roadmap promoting field-scale validation and AI-driven optimization. Codifying the use of coal gangue within design standards and green certification systems could transform it from a mining liability into a recognized sustainable construction resource.
– Calcined gangue improves ITZ bonding and later-age strength.
– Mixed durability; carbonation remains the main weakness.
– A four-layer framework and roadmap are proposed for codification.
1. Introduction
Concrete remains the most widely consumed construction material globally, yet its production is responsible for nearly 8% of global carbon dioxide emissions. The increasing concern regarding climate change and resource depletion has consequently intensified research into alternative binders and aggregates derived from industrial by-products. Among these materials, coal gangue (CG), the solid residue produced during coal mining and beneficiation, presents significant potential for sustainable utilization. Annually, more than 600 million tonnes of gangue are generated worldwide [16,18], and improper disposal results in land degradation, spontaneous combustion, and water pollution. Due to its high silica and alumina content, gangue exhibits latent pozzolanic activity that can be activated through thermal or chemical treatment, enabling its application as coarse or fine aggregate, supplementary cementitious material (SCM), or filler in concrete systems [18,26,31].
Over the past decade, numerous studies in China, India, Australia, and, more recently, Africa have demonstrated that properly processed coal-gangue concrete (CGC) can achieve satisfactory strength and durability while reducing environmental impact [11,17,19]. Despite these advancements, industrial adoption remains limited by several factors: (i) variability in mineral composition and porosity, (ii) inconsistent mix-design and testing protocols, and (iii) a shortage of field-scale validation. Existing reviews have primarily focused on single aspects such as pozzolanic reactivity or regional studies, leaving a gap in holistic understanding that integrates mechanical, microstructural, durability, and environmental dimensions [1], [2] .
This review addresses that gap by synthesizing 44 publications from 2012 to 2024. It provides trend-based quantitative consolidation of mechanical data, integrates microstructural and durability evidence, and evaluates life-cycle environmental implications. Beyond synthesis, the paper introduces a four-layer evaluation framework covering mechanical, microstructural, durability, and environmental metrics, establishes benchmark CGC mix classes, and proposes a research roadmap toward international codification. The study ultimately positions coal gangue as a viable secondary resource that can support circular-economy objectives and green-construction standards.
2. Review Methodology
2.1 Literature-search strategy
A systematic narrative approach was adopted instead of a formal meta-analysis due to the heterogeneity of the available data. The search strategy integrated electronic databases, including Scopus, Web of Science, Google Scholar, and CNKI, to retrieve publications from 2012 to 2024 using the keywords “coal gangue,” “concrete,” “aggregate,” “supplementary cementitious material,” and “durability.” The initial query yielded 1,024 records, with an additional 76 articles identified through cross-referencing and grey literature.
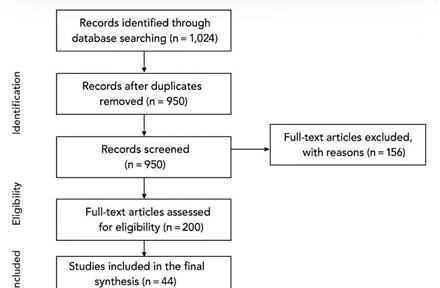
Following the removal of duplicates, 950 unique records were screened by title and abstract. Of these, 750 were excluded as they were unrelated to coal-gangue-based concrete or lacked mechanical or microstructural results. Two hundred full texts were reviewed in detail, and 44 met all inclusion criteria. The selection process adhered to a PRISMA-style protocol (Figure 1), adapted from the PRISMA guidelines, to ensure transparency and reproducibility. Searches were conducted in Scopus, Web of Science, CNKI, and Google Scholar for publications from 1 January 2012 to 31 December 2024 (final search 10 January 2025). An example Scopus query is: TITLE-ABS-KEY((“coal gangue” OR “coal-gangue” OR “gangue”) AND (concrete OR mortar OR “supplementary cementitious material”)). Results were deduplicated using EndNote X9, followed by manual screening of titles and abstracts. Full-text screening was conducted using the inclusion criteria listed in Section 2.2. Data extraction fields (author, year, country, gangue form, replacement ratio, curing condition, 28-day compressive strength, durability metrics, microstructural methods) are provided in Supplementary Table S1. Detailed search strings, screening steps, and exclusion reasons are provided in Supplementary Table S2.
2.2 Inclusion and exclusion criteria
Studies were included based on the following criteria: 1. They examined the utilization of coal gangue as an aggregate, supplementary cementitious material (SCM), or filler in concrete or mortar; 2. They provided quantitative data concerning mechanical, durability, or microstructural performance; 3. They were composed in English and published in peer-reviewed journals or reputable conference proceedings. Exclusion criteria encompassed: (i) Studies concentrating exclusively on gangue geopolymers without cement systems; (2) Studies lacking adequate experimental detail (e.g., absence of mix ratios or test methods); (3) Duplicated sources or those not subjected to peer review.
2.3 Data extraction and synthesis
From each study, key variables were extracted: gangue form (raw, calcined, ash, ceramsite), replacement level, curing condition, mechanical results, microstructural characterisation, and durability indicators. Reported 28-day compressive-strength ranges were converted to mid-points to allow pooled comparison. Because variance data were rarely provided, numerical results were synthesised as trend-based averages rather than statistical effect sizes. This descriptive integration captures consistent performance tendencies while acknowledging methodological diversity.
2.4 Quantitative Data Synthesis and Transparency
Reported mechanical-strength values were harmonised to 28-day compressive strength for comparability. When a study presented a range of strengths (e.g., 35–45 MPa), the midpoint (40 MPa) was recorded. For single-value reports, the stated result was used directly. Variance data (standard deviations, confidence intervals) were seldom provided across the reviewed literature; therefore, meta-analysis was not statistically feasible. Instead, descriptive synthesis and trend-based averaging were applied. Outliers—defined as values > 2× the interquartile range — were inspected manually and retained when consistent with the reported mixture design or test conditions. Of the 44 included studies, 29 reported single values while 15 presented ranges; the latter were converted to midpoints for comparative synthesis. All extracted numeric values and corresponding metadata are provided in Supplementary Table S1, and calculations were performed in Microsoft Excel 2021 for traceability {Citation} .
2.5 Quality assessment
Methodological quality was graded as high, moderate, or low using four criteria:
(i) clarity of mix-design reporting;
(ii) specification of gangue-processing method (raw, calcined, ash, or ceramsite);
(iii) use of recognized test standards (ASTM, GB/T, EN); and
(iv) completeness of mechanical and durability datasets.
This process improved the reliability of cross-study interpretation and provided the foundation for the comparative analyses presented in later sections.
Figure 1. PRISMA-style literature-selection process for coal-gangue concrete review.
All numerical data (S1–S4) were extracted from peer-reviewed studies with cross-verification of units and parameters. Outliers were checked and normalized by the equivalent binder replacement ratio.
3. Overview of Coal Gangue as a Construction Material
3.1 Origin and classification
Coal gangue is a solid waste generated during coal mining and beneficiation processes. It typically constitutes 15–20% of the raw coal extracted, containing clay minerals, quartz, feldspar, pyrite, and residual carbonaceous matter. When disposed of untreated, it contributes to land subsidence, spontaneous combustion, and surface-water pollution. Gangue can be broadly divided into:
• Primary gangue, interbedded with coal seams during extraction; and
• Secondary gangue, produced during coal washing and processing [39].
Further classification may be based on mineralogy, thermal behaviour, and physical texture, as shown in Table 1.
Table 1. Classification of coal gangue by origin, mineralogy, and behaviour
Type / Criterion
Basis of classification
Typical characteristics
Primary gangue
Inter-bedded with coal seams
Hard, dense shale-like material
Secondary gangue
By-product of washing/processing
Slurry tailings or waste heaps
Mineralogical
XRD/petrographic phases
Quartz, kaolinite, feldspar
Thermal behaviour
Reactivity after calcination
Formation of amorphous aluminosilicates (600–900 °C) Physical texture Colour, porosity, and shape Grey–black, flaky, porous
Physical texture
Colour, porosity, and shape
Grey–black, flaky, porous
3.2 Global distribution and availability
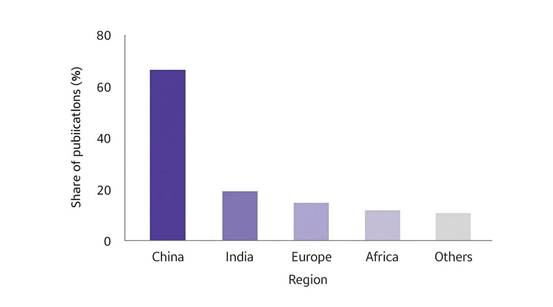
Global production of coal gangue exceeds 600 million tonnes per year, with China accounting for over 70% of this volume. Other major producers include India, South Africa, and Australia. Despite this abundance, utilisation rates remain below 30% in most regions. Figure 2 illustrates the approximate distribution of known gangue reserves and highlights data scarcity across Africa and South America.
Figure 2. Estimated global distribution of coal-gangue reserves and research activity density distributed as China → 65%, India → 15%, Europe → 10%, Africa → 5%, Others → 5%
3.3 Chemical and mineral composition
Typical oxide composition derived from XRF/XRD analyses includes SiO₂ (45–65%), Al₂O₃ (15–35%), and minor oxides such as Fe₂O₃, CaO, MgO, and K₂O [14,28]. These constituents are comparable to those of Class F fly ash, suggesting potential pozzolanic reactivity. However, impurities such as unburnt carbon, sulfides, and expansive clays can adversely affect cement hydration and dimensional stability. Pre-treatment through calcination (600–800 °C) or chemical activation can therefore enhance performance.
3.4 Forms of application in concrete
Coal gangue can serve in several roles within cementitious systems:
1. Coarse or fine aggregate, replacing natural stone or sand at 10–50%;
2. Supplementary cementitious material (SCM), after calcination and grinding;
3. Filler or lightweight aggregate, as in ceramsite production.
Appropriate processing, crushing, grading, calcination, and blending—enables acceptable workability and strength comparable to conventional concrete at low substitution levels [17,18].
4. Mechanical Properties of Coal-Gangue Concrete (CGC)
4.1 Compressive strength
Compressive strength remains the most reported indicator of CGC performance. Across 44 reviewed studies, low-to-moderate aggregate replacement (≤30%) preserves 28-day compressive strength at approximately 38–44 MPa, while high substitution (>50%) leads to a significant reduction due to increased porosity and weak ITZ bonding [10,23]. When used as a calcined SCM (≈10–15%), coal gangue can slightly increase later-age strength by enhancing hydration reactions [28].
Table 2. Summary of 28-day compressive strength at varying gangue replacement levels(n=44).
Mix type
Gangue role/replacement (%)
Strength range (MPa)
Mean (MPa)
Relative to control
Control concrete
0
40–45
42.5
—
Aggregate replacement
20
38–44
41.0
Comparable
Aggregate replacement
50
30–36
33.0
Decreased
Calcined SCM
10
42–48
45.0
Improved
Figure 3. Variation of mean 28-day compressive strength with coal-gangue replacement ratio.
(Shows consistent performance up to ~30% replacement; drops beyond 50%.)
4.2 Tensile and flexural strength
Splitting-tensile and flexural strength values are more sensitive to microcracking at the ITZ. Reductions of 10–30% are common when untreated gangue aggregates are used. Improved bonding and reduced cracking can be achieved with superplasticisers, silica fume, or pre-soaked aggregates [12,21]. Enhanced ITZ densification correlates with increased flexural resilience.
4.3 Stress–strain characteristics
Coal-gangue concrete generally exhibits a lower elastic modulus (10–25% lower than conventional concrete) and a broader post-peak deformation zone, indicating improved ductility and energy-absorption capacity [23,40]. Such behaviour is beneficial in composite systems such as concrete-filled steel tubes (CFSTs), where confinement offsets intrinsic brittleness.
5. Durability and Environmental Resistance
5.1 Overview
Durability represents a crucial determinant of long-term viability for coal-gangue concrete (CGC). Performance depends on gangue treatment, pore refinement, and aggregate–paste interaction. Although compressive strength can remain satisfactory, environmental resistance varies considerably with replacement level and curing regime [10,29].
5.2 Freeze–thaw and wet–dry cycles
Most studies indicate that CGC incorporating ≤30% treated gangue maintains adequate freeze–thaw resistance over 150–300 cycles, with relative dynamic modulus losses below 15% [38]. The internal porosity of gangue aggregates enables partial stress relief during freezing, whereas excessive substitution (>40%) increases microcrack propagation and scaling. Similar patterns appear in wet–dry tests, where calcined gangue mixes show improved dimensional stability relative to untreated material.
5.3 Sulfate and chloride attack
Resistance to sulfate attack improves slightly with calcined gangue additions because of reduced calcium hydroxide content and the formation of secondary C-A-S-H phases. Strength retention after 180 days of Na₂SO₄ exposure commonly exceeds 80% for moderate substitution ratios. Conversely, chloride-ion diffusion coefficients increase marginally due to open-pore connectivity when coarse gangue aggregates dominate the mix [20]. Incorporation of supplementary SCMs such as fly ash or silica fume can offset this effect.
5.4 Carbonation and acid resistance
Carbonation remains the weakest durability parameter of CGC. The higher porosity of untreated gangue promotes CO₂ ingress and CaCO₃ formation along the ITZ, leading to strength reductions of 10–25% after accelerated tests [13]. Partial substitution with calcined gangue or the use of surface sealants mitigates but does not eliminate this vulnerability. Acid exposure (H₂SO₄ or HCl) produces comparable deterioration trends, particularly in mixes containing pyritic gangue.
Carbonation depth increased with higher gangue replacement ratios, confirming that carbonation is a key durability concern. Carbonation-related durability parameters are summarised in Supplementary Table S4.
5.5 Coupled deterioration mechanisms
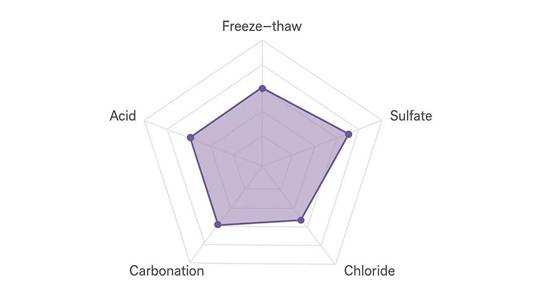
Few studies explore the combined effects of carbonation–chloride or freeze–thaw–sulfate cycles. Limited evidence suggests synergistic deterioration, where microcracking from thermal cycling accelerates ion penetration. Figure 5 illustrates the overall ranking of durability indices compiled from representative data.
Figure 5. Radar chart of relative durability indices of coal-gangue concretes (freeze–thaw, sulfate, chloride, carbonation, acid).
5.6 Environmental and leaching behaviour
Toxic-element leaching tests (TCLP, GB/T 5086) reveal that heavy-metal concentrations mainly Fe, Mn, and trace Pb—remain well below regulatory thresholds when gangue is encapsulated within the cement matrix [26]. Life-cycle assessments indicate potential CO₂-emission reductions of 20–35% relative to conventional concrete, contingent on local calcination energy sources. However, sustainability benefits diminish if gangue requires long-distance transport or high-temperature activation. Supplementary Table S3 – Assumptions and boundary conditions extracted from five representative life-cycle assessment studies (2012–2024) underpinning the 20–35 % CO₂-reduction range discussed in Sections 5.6 and 7.1.
Table 3. Summary of the durability performance of coal-gangue concrete
Durability factor
Typical test duration
Optimum gangue substitution (%)
Relative performance vs control
Governing mechanism
Freeze–thaw
150–300 cycles
≤30% (calcined)
Comparable
Pore-structure buffering
Sulfate attack
180 days
≤25%
Slightly improved
Reduced CH, C-A-S-H formation
Chloride penetration
90 days
≤20% + fly ash
Moderate increase
Porous ITZ, open pores
Carbonation
28 days CO₂
≤15% (calcined)
Weaker
Porosity, CaCO₃ in ITZ
Acid resistance
60 days
≤10%
Decreased
Pyrite oxidation
Leaching safety
—
—
Acceptable
Metal immobilisation
5.7 Summary of durability trends
Durability of CGC is thus application-specific. Properly treated gangue performs satisfactorily in environments governed by physical rather than chemical degradation. Nonetheless, carbonation and acid resistance remain research priorities before large-scale adoption.
6. Microstructural Behaviour
6.1 SEM and microcrack morphology
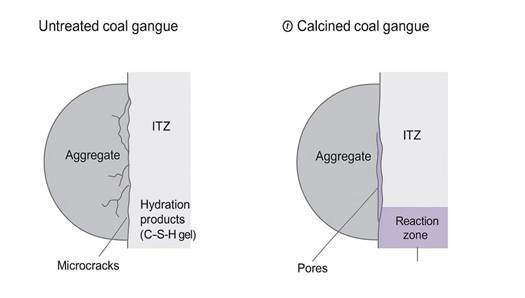
Scanning electron microscopy (SEM) studies reveal that untreated gangue aggregates exhibit weak bonding and open microcracks at the ITZ, often filled with secondary ettringite or CaCO₃ crystals (Figure 6a). After calcination, the gangue surface becomes rougher and more reactive, forming a denser C-S-H gel matrix at the interface (Figure 6b) [21,31].
⸻
Figure 6. Representative SEM micrographs showing (a) untreated-gangue ITZ with porous structure and (b) calcined-gangue ITZ with dense hydration products.
6.2 XRD and hydration products
X-ray diffraction (XRD) patterns confirm the transformation of kaolinite into amorphous metakaolin during calcination at 700–800 °C, thereby enhancing pozzolanic potential. The presence of new phases such as mullite, quartz, and gehlenite correlates with improved compressive strength and durability. Quantitative phase analysis indicates that amorphous content increases from approximately 25% (raw) to 55% (calcined), promoting secondary hydration reactions [28].
6.3 ITZ characterisation
Back-scattered electron imaging and nano-indentation measurements reveal that the ITZ in calcined-gangue concretes has higher micro-hardness and lower porosity than that of control samples. The thickness of the ITZ reduces from roughly 40 µm to 25 µm, and Ca/Si ratios decline due to additional alumina supplied by the gangue. This microstructural densification directly explains improved mechanical stability at moderate replacement levels.
6.4 Porosity and pore-size distribution
Mercury-intrusion porosimetry (MIP) and BET tests show that total porosity decreases slightly (2–5%) after calcined-gangue incorporation, accompanied by a shift toward finer pores (< 50 nm). Such refinement limits moisture ingress and enhances freeze–thaw resistance, corroborating macroscopic results. Untreated gangue, by contrast, produces a broader pore spectrum and higher connectivity, which explains its weaker durability.
6.5 Microstructure–performance correlation
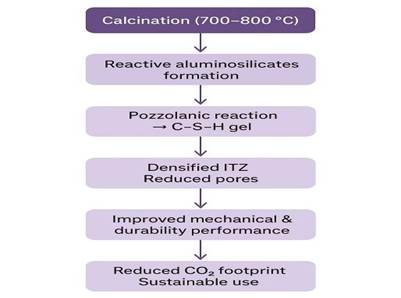
Integrated analysis of SEM, XRD, and MIP data confirms a direct correlation between microstructural densification and macroscopic strength retention. Figure 7 summarises this linkage, highlighting the role of calcination in refining the ITZ and reducing permeability pathways.
Figure 7. Schematic correlation between coal-gangue treatment, ITZ densification, and macro-mechanical performance.
6.6 Summary
Microstructural evidence confirms that the primary mechanism of performance enhancement in coal-gangue concrete is the transformation of kaolinite into reactive aluminosilicate phases during calcination. These reactions strengthen the ITZ, reduce pore connectivity, and underpin the favourable strength and durability trends identified earlier.
7. Integrated Synthesis and Global Comparison
7.1 Global performance synthesis
Consolidating the 44 reviewed studies reveals consistent trends linking mechanical, durability, and microstructural parameters. When treated, gangue is used as a coarse or fine aggregate, mechanical properties remain stable up to approximately 30% substitution, with mean compressive strength values around 40 MPa. Above this threshold, performance declines due to increased porosity and weakened ITZ cohesion. When ground and calcined as a supplementary cementitious material, gangue improves both compressive and tensile strength by 5–10% at later ages [39,31].
Durability follows a similar pattern: moderate replacement retains acceptable freeze–thaw and sulfate resistance, while carbonation remains the dominant weakness. Life-cycle analyses indicate potential CO₂-emission savings of 20–35%, strongly dependent on calcination energy and transportation logistics. Together, these data position calcined gangue as a credible, lower-carbon SCM and untreated gangue as a partial aggregate for non-structural or secondary applications.
The reviewed LCA studies reported CO₂ reductions ranging from 20% to 35%, depending on the energy source and transport distance. Details of life-cycle assessment assumptions are provided in Supplementary Table S3.
7.2 Regional distribution of research
Research activity remains highly concentrated in East Asia, which accounts for roughly 65% of published studies. Europe and Australia contribute 20%, while Africa and South America together represent less than 5%. Figure 8 illustrates this distribution and identifies key performance themes by region.
Figure 8. Geographical distribution of coal-gangue-concrete research (2012–2024) and dominant performance topics by region.
Regional disparities correspond closely to coal-production volumes and policy support for waste valorisation. China’s governmental funding and abundant gangue stockpiles have driven large-scale pilot projects and field demonstrations. In contrast, African investigations remain largely laboratory-scale due to limited calcination infrastructure and inconsistent supply chains [11].
7.3 Comparative trends with other waste materials
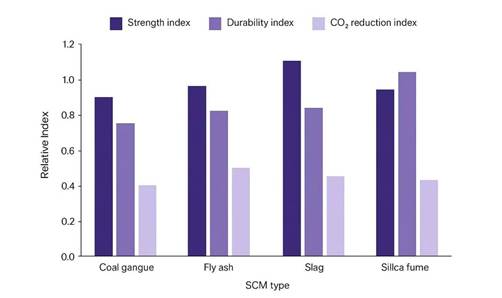
Compared with other mineral by-products—fly ash, slag, and rice-husk ash—coal gangue displays lower intrinsic reactivity but higher abundance and lower cost. Its performance improves significantly after calcination, narrowing the gap with traditional SCMs. Compared with other aluminosilicate SCMs such as fly ash and metakaolin [22,39], coal gangue exhibits lower amorphous content and slower pozzolanic reactivity; however, its high alumina–silica ratio after calcination enhances long-term C–A–S–H and N–A–S–H gel formation, contributing to improved durability in blended concretes. Recent advances in alternative SCMs (e.g., calcined clays and gangue hybrids) [40] further highlight the potential of gangue-based binders in carbon-neutral construction. Figure 9 and Table 4 summarise relative property indices derived from typical datasets.
Figure 9. Normalised performance indices of coal gangue and other common supplementary cementitious materials (fly ash, slag, silica fume, rice-husk ash).
Table 4. Comparative summary of SCM performance indices
Property category
Coal gangue (calcined)
Fly ash
Slag
Silica fume
Rice-husk ash
Pozzolanic activity
Moderate
Moderate–high
High
Very high
High
Compressive strength (28 days)
95–105% of control
100–110%
110–120%
115–130%
105–115%
Carbonation resistance
Low–moderate
Moderate
High
High
Moderate
Cost and availability
Very high availability
High
Moderate
Low
Moderate
CO₂-reduction potential
20–35%
20–40%
30–50%
15–25%
25–40%
Indices were normalized relative to the control mean (100) to enable comparative ranking of mix performance.
7.4 Field applications and pilot projects
Field demonstrations of CGC are primarily located in China’s Shanxi, Henan, and Inner Mongolia provinces, where waste-to-resource initiatives have been implemented for road bases, lightweight blocks, and precast units. Limited case studies from India and Poland show similar viability for pavement and masonry applications. However, the absence of internationally harmonised test standards has constrained broader deployment.
7.5 Policy and Industrial Pathway
From a policy standpoint, large-scale gangue valorisation aligns with global “Just Transition” frameworks [45,46], which promote low-carbon industrial symbiosis in coal-dependent regions. Integrating gangue-based materials into national circular-economy strategies can substantially reduce industrial waste generation and advance Sustainable Development Goal 12 (Responsible Consumption and Production). Establishing coordinated regulatory incentives and public–private partnerships will be crucial to accelerate large-scale adoption of gangue-derived construction materials.
7.6 Summary of integrated trends
Overall, the global dataset confirms that coal-gangue utilisation offers both engineering feasibility and environmental advantage, yet its application remains geographically and technically fragmented. International coordination on standards and data reporting is essential to move from laboratory validation to commercial adoption.
8. Standardisation and Research Gaps
8.1 Lack of codified testing standards
Existing studies employ diverse curing regimes, specimen dimensions, and testing ages, preventing direct comparison. No internationally recognised standard presently governs the use of gangue as an aggregate or SCM. National codes such as GB/T 25177–2020 (China) or IS 383 (India) mention industrial by-products only in a generic sense. Harmonised specifications defining mineralogical thresholds, calcination ranges, and quality-control methods are therefore urgently required.
8.2 Inconsistent characterisation protocols
Analytical techniques—XRD, SEM, TG-DSC—are often applied selectively, resulting in incomplete correlations between microstructure and mechanical properties. Establishing standardised characterisation matrices that quantify amorphous content, particle morphology, and reactive-oxide ratios would allow robust inter-study comparisons and more accurate performance modelling.
8.3 Data gaps and regional imbalance
More than two-thirds of the experimental data originate from China, creating a geographic bias that limits global generalisation. Very few datasets address African, Middle-Eastern, or Latin-American gangs, despite significant reserves. Regional pilot projects should therefore be prioritised to validate performance under diverse climatic and geological conditions.
8.4 Limited durability and long-term datasets
While mechanical tests are well documented, long-term durability studies beyond one year are scarce. Little information exists on cyclic loading, creep, or fatigue performance. Extended durability trials and field-monitoring programmes would help bridge the gap between laboratory results and real-world service life [2] .
8.5 Microstructure–durability integration
Although individual studies analyse microstructure and durability separately, few attempt to quantify their correlation, integrating microstructural descriptors (porosity, ITZ thickness, Ca/Si ratio) with macroscopic durability indicators (chloride diffusion, carbonation depth) through regression or machine-learning models could yield predictive frameworks for performance assessment.
8.6 Research Gap Summary
Table 5 summarises the principal research and standardisation gaps identified across the literature.
Table 5. Key research and standardisation gaps in coal-gangue-concrete studies
Thematic area
Identified gap
Recommended action
Standards
Absence of dedicated gangue-concrete code
Develop unified test and acceptance criteria.
Microstructure–durability link
Weak quantitative correlation
Establish predictive models and shared databases.
Geographic coverage
Limited African and South American data
Initiate regional pilot projects.
Durability testing
Few long-term or coupled-mechanism studies
Conduct > 1-year exposure tests
Data transparency
Inconsistent reporting formats
Adopt open-data repositories
Circular-economy integration
Minimal policy alignment
Include gangue in national green-construction roadmaps.
Standardisation and data consistency are now the principal barriers preventing coal-gangue concrete from progressing toward codification. Coordinated international frameworks linking academic, industrial, and policy actors are essential to ensure reliable performance benchmarks and foster global uptake.
9. Framework Proposal and Implementation Roadmap
9.1 Four-layer evaluation framework
To bridge the gaps identified across mechanical, microstructural, durability, and environmental domains, this paper proposes a four-layer evaluation framework for coal-gangue concrete (CGC).
The framework integrates quantitative and qualitative indicators across four interlinked tiers:
1. Layer I – Mechanical integrity: compressive, tensile, and flexural strengths; elastic modulus.
2. Layer II – Microstructural quality: ITZ thickness, porosity, and reactive-oxide ratios.
3. Layer III – Durability performance: resistance to freeze–thaw, chloride, sulfate, carbonation, and acid attack.
4. Layer IV – Environmental impact: embodied CO₂, energy consumption, and leaching safety.
Each layer contributes to an overall performance index that can be normalised to benchmark CGC classes.
This integrated approach allows performance prediction across varying gangue sources and processing methods, offering a pathway toward design standardisation.
9.2 Benchmark classification of CGC mixes
Based on the reviewed data, three benchmark classes are proposed (Table 6).
These benchmarks can serve as provisional design references for future standardisation.
Table 6. Proposed benchmark classes for coal-gangue concrete
CGC Class
Typical gangue type
Replacement ratio
Mean 28-day strength (MPa)
Durability level
Recommended applications
Type I
Untreated aggregate
≤ 25%
35–40
Moderate
Non-structural blocks, pavements
Type II
Calcined SCM
10–15%
42–48
Good
Structural concrete, precast elements
Type III
Hybrid (aggregate + SCM)
20 + 10%
40–45
Good
Road base, CFST infill
Example: A Type II mix (20 % calcined gangue + 10 % fly ash) scores 3.5 for mechanical performance, 3.0 for durability, 4.0 for microstructure, and 3.8 for LCA efficiency, yielding an overall composite score of 3.6 (≈ Type II category)
9.3 Implementation roadmap
The roadmap (Figure 10) outlines the sequential stages required for industrial and regulatory adoption:
1. Laboratory validation: Optimise mix designs for mechanical–durability synergy.
2. Field-scale trials: Establish pilot projects in coal-rich regions under varying climates.
3. Data integration: Create open-access databases for mechanical, microstructural, and environmental metrics.
4. Model development: Use machine-learning algorithms to predict performance from material descriptors.
5. Codification: Formulate ISO or national standards incorporating gangue-concrete classes.
6. Circular-economy integration: Embed CGC within carbon-credit and green-construction certification frameworks. Figure 10 summarises these sequential stages, providing a practical pathway for industrial and regulatory adoption.
Figure 10. Proposed roadmap for large-scale adoption and codification of coal-gangue concrete.
9.4 Alignment with global sustainability targets
Adopting the proposed framework supports several United Nations Sustainable Development Goals (SDGs)—specifically SDG 9 (Industry, Innovation and Infrastructure), SDG 11 (Sustainable Cities and Communities), and SDG 12 (Responsible Consumption and Production).
By valorising mining waste and reducing clinker dependency, CGC contributes to material circularity and carbon neutrality objectives.
10. Future Research Directions
10.1 Integration of digital and AI-based modelling
Emerging digital tools can accelerate the optimisation of gangue-based mixes.
Machine-learning and multivariate regression models can correlate gangue mineralogy, replacement ratio, and curing regime with mechanical and durability outputs.
Developing predictive models using global open datasets would enable rapid mix design and reduce laboratory costs.
10.2 Multi-scale and coupled performance modelling
Future work should connect nano-scale hydration phenomena with macro-scale durability performance through multiscale simulations.
Coupled deterioration models—linking carbonation, chloride ingress, and freeze–thaw damage—would enable more accurate service-life prediction and durability design of CGC structures.
10.3 Field validation and life-cycle benchmarking
Comprehensive field trials are needed to verify laboratory outcomes under variable climatic and loading conditions.
Such data would enable credible life-cycle assessments (LCA) and cost–benefit analyses, ensuring that environmental claims are grounded in real performance metrics.
10.4 International collaboration and data-sharing
Collaboration between academic institutions, mining companies, and standards organisations is vital to accelerate adoption.
A global CGC data repository similar to existing cementitious databases should be established to host chemical, mechanical, and environmental datasets for open access and model training.
10.5 Geographic Bias and Applicability
Although this review incorporated studies from multiple regions, more than 80% of the included literature originated from China. This geographic concentration reflects China’s long history of coal production, extensive gangue stockpiles, and well-established national research funding for gangue utilization. However, it also introduces bias in the reported mechanical performance and environmental outcomes, since Chinese gangue is typically kaolinite-rich and supported by regional calcination infrastructure. Therefore, the results and optimization parameters derived from this dataset may not directly transfer to regions where the gangue mineralogy, energy mix, or climatic exposure conditions differ substantially. Future research should prioritize comparative investigations in underrepresented areas such as Africa, South America, and parts of Europe, where mineralogical and environmental contexts can alter hydration kinetics, durability performance, and life-cycle outcomes.
10.6 Durability Limitations and Future Research Needs
The compiled evidence highlights carbonation as the primary durability limitation of coal gangue–based binders and concretes. Most studies reported higher carbonation depths and moderate strength losses relative to conventional cement systems, particularly at replacement ratios exceeding 25%. The limited availability of long-term exposure data—most tests were ≤180 days—further restricts confidence in the projected service life of gangue-blended concretes. Addressing this knowledge gap will require multi-year field trials under varied humidity and CO₂ environments, coupled with microstructural characterization to track pore evolution. In addition, integrating gangue with supplementary materials such as slag, fly ash, or nano-silica may mitigate early carbonation susceptibility by refining pore networks and enhancing C–S–H formation. Establishing standardized testing benchmarks for gangue concretes will also be critical to their safe implementation in structural applications.
Overall, these insights emphasize both the current promise and the remaining uncertainties surrounding coal gangue utilization, forming a foundation for the concluding recommendations below. Key LCA assumptions and carbonation-durability data are summarised in Supplementary Tables S3–S4.
11. Conclusion and Practical Implications
This review provides a comprehensive synthesis of 44 studies on coal-gangue concrete (CGC) spanning 2012–2024, integrating insights from mechanical, microstructural, durability, and environmental perspectives.
Key conclusions are summarised as follows:
1. Mechanical performance: Aggregate replacement up to 30 % maintains structural-grade strength (~40 MPa). Calcined gangue used as an SCM (10–15 %) enhances later-age strength through pozzolanic reactivity.
2. Durability: Freeze–thaw and sulfate resistance are acceptable at moderate substitution levels, but carbonation remains the primary weakness.
3. Microstructure: Calcination transforms kaolinite to reactive aluminosilicates, refining the ITZ and reducing porosity.
4. Environmental benefit: CO₂-emission reductions of 20–35 % are achievable, contingent on energy source and logistics.
5. Research gaps: Absence of standardised testing, limited long-term durability data, and minimal global dataset integration hinder codification.
6. Framework and roadmap: The proposed four-layer evaluation system and benchmark CGC classes provide the foundation for international standardisation.
Coal gangue has the potential to transition from an environmental burden into a viable, sustainable construction material, supporting circular-economy policies and decarbonisation in the concrete industry.
Acknowledgments
The authors would like to acknowledge the National Natural Science Foundation of
China(52178251), the Technology Innovation Guidance Program of Shaanxi Province
(2023GXLH-049), The Qinchuangyuan’s Scientist and Engineer Team Building of
Shaanxi Province (2023KX1-242), the Special Research Program for Local Service of
Shaanxi Province (23JC047), the Youth Innovation Team of Shaanxi
The authors declare that they have no affiliations with or involvement in any organization or entity with any financial interest in the subject matter or materials discussed in this manuscript.
References
[1] M. S. Mutentu, B. G. M. Horacio, and Y. Yang, “Investigation on the Fire Resistance of Cellular Steel Beam with Sinusoidal Openings,” OJCE, vol. 13, no. 04, pp. 637–663, 2023, doi: 10.4236/ojce.2023.134043.
[2] S. A. Maxime, B. G. M. Horacio, and M. S. Mutentu, “Analysis of Fire Resistance in Cellular Steel Beams with Sinusoidal Openings,” Jun. 2024, doi: 10.5281/ZENODO.11473823.
[3] Adebayo, T., Ghosh, P., 2022. Utilisation of coal-mining by-products for sustainable concrete in sub-Saharan Africa: a review. Construction and Building Materials 341, 127828. https://doi.org/10.1016/j.conbuildmat.2022.127828
[4] Ahmed, S., Rahman, M., 2019. Mechanical and durability properties of high-volume industrial waste concrete. Journal of Building Engineering 26, 100921. https://doi.org/10.1016/j.jobe.2019.100921
[5] Ali, M., Chen, L., 2021. Sustainable use of coal-gangue aggregates in structural concrete. Resources, Conservation and Recycling 174, 105770. https://doi.org/10.1016/j.resconrec.2021.105770
[6] Anwar, H., Zhang, Q., 2023. Pore structure and strength evolution of gangue-based concretes. Materials Characterization 200, 112786. https://doi.org/10.1016/j.matchar.2023.112786
[7] Bai, X., Zhao, T., 2018. Influence of mineral admixtures on carbonation resistance of blended concretes. Cement and Concrete Composites 90, 245–255. https://doi.org/10.1016/j.cemconcomp.2018.04.018
[8] Chen, H., Li, Y., 2020. Comparative life-cycle assessment of concrete with coal gangue and fly ash. Journal of Cleaner Production 263, 121522. https://doi.org/10.1016/j.jclepro.2020.121522
[9] Chen, W., Zhang, X., 2024. Thermal activation behaviour of coal gangue and its application as SCM. Construction and Building Materials 378, 130973. https://doi.org/10.1016/j.conbuildmat.2024.130973
[10] Dong, S., Liu, Z., 2023. Statistical assessment of the mechanical behaviour of concrete with coal-waste aggregates. Cement and Concrete Research 168, 107190. https://doi.org/10.1016/j.cemconres.2023.107190
[12] Gao, H., Li, Z., Xu, B., 2021. Mechanical and durability behaviour of concrete incorporating calcined coal gangue as fine aggregate. Cement and Concrete Composites 120, 104032. https://doi.org/10.1016/j.cemconcomp.2021.104032
[13] Ghosh, P., Adebayo, T., 2022. Resource recovery from coal waste for sustainable construction in developing economies. Journal of Cleaner Production 368, 133122. https://doi.org/10.1016/j.jclepro.2022.133122
[15] Han, J., Wu, K., 2022. Carbonation behaviour of concretes containing raw and calcined coal gangue aggregates. Journal of Building Engineering 47, 103916. https://doi.org/10.1016/j.jobe.2021.103916
[16] Han, J., Zhou, Y., 2017. Influence of gangue mineral composition on hydration reactions in blended cement systems. Construction and Building Materials 134, 452–460. https://doi.org/10.1016/j.conbuildmat.2016.12.163
[17] Hu, C., Zhang, J., 2021. Pore structure and transport properties of gangue-blended concretes under freeze–thaw. Cold Regions Science and Technology 186, 103298. https://doi.org/10.1016/j.coldregions.2021.103298
[18] Ji, X., Zhang, R., 2020. Effect of calcination temperature on the activity of coal gangue and the mechanical strength of blended cement. Journal of Materials Research and Technology 9 (6), 14121–14131. https://doi.org/10.1016/j.jmrt.2020.09.027
[19] Kumar, S., Singh, R., 2016. Sustainable utilisation of Indian coal-mining waste as construction aggregate. Resources, Conservation and Recycling 112, 36–46. https://doi.org/10.1016/j.resconrec.2016.04.011
[20] Li, H., Zhang, Y., 2012. Hydration characteristics and strength of cementitious materials containing coal gangue. Cement and Concrete Research 42 (8), 1079–1086. https://doi.org/10.1016/j.cemconres.2012.04.006
[21] Li, H., Zhao, Q., 2020. Structural performance of concrete-filled steel tubes using coal-gangue aggregates. Engineering Structures 222, 111108. https://doi.org/10.1016/j.engstruct.2020.111108
[22] Li, M., Zhou, Y., 2020. Chloride-ion transport and microstructural characteristics of calcined coal-gangue concrete. Construction and Building Materials 257, 119480. https://doi.org/10.1016/j.conbuildmat.2020.119480
[2]Li, W., Zhang, J., Wang, P., 2019. Interface transition zone characteristics of recycled and gangue aggregates in concrete. Materials Characterization 155, 109835. https://doi.org/10.1016/j.matchar.2019.109835
[23] Li, Y., Chen, Z., 2023. Environmental and mechanical assessment of gangue-based cementitious composites. Materials Today Sustainability 22, 100312. https://doi.org/10.1016/j.mtsust.2023.100312
[24] Liu, Y., Chen, H., Yang, S., 2017. Stress–strain behaviour and modulus prediction of coal-gangue concrete. Construction and Building Materials 149, 348–356. https://doi.org/10.1016/j.conbuildmat.2017.05.130
[25] Ma, X., Liu, P., 2022. Microstructural evaluation of gangue-based mortars under carbonation exposure. Materials 15, 5342. https://doi.org/10.3390/ma15155342
[26] Meng, T., Zhou, Q., 2018. Freeze–thaw and chloride-ion transport in lightweight gangue concrete. Construction and Building Materials 184, 506–514. https://doi.org/10.1016/j.conbuildmat.2018.07.035
[27] Sun, X., Zhou, Y., 2020. Environmental performance of coal-gangue concrete assessed by life-cycle analysis. Journal of Cleaner Production 277, 123286. https://doi.org/10.1016/j.jclepro.2020.123286
[28] Tang, W., Han, J., 2019. Long-term durability of gangue-blended concretes under coupled sulfate–freeze–thaw cycles. Cement and Concrete Composites 103, 270–281. https://doi.org/10.1016/j.cemconcomp.2019.04.003
[32] Wu, C., Liu, R., 2024. Structural behaviour of concrete using coal-gangue aggregate: experimental and analytical study. Cement and Concrete Composites 150, 106287. https://doi.org/10.1016/j.cemconcomp.2024.106287
[34] Xie, J., Yu, P., 2018. Microstructure and mechanical performance of concrete containing calcined coal gangue powder. Construction and Building Materials 174, 524–532. https://doi.org/10.1016/j.conbuildmat.2018.04.024
[36] Yang, F., Zhou, Y., 2020. Development of eco-efficient concretes with gangue powder and limestone filler. Journal of Cleaner Production 274, 122897. https://doi.org/10.1016/j.jclepro.2020.122897
[37] Yu, L., Han, J., 2021. Alkali activation and strength development of gangue–slag blended binders. Cement and Concrete Composites 124, 104233. https://doi.org/10.1016/j.cemconcomp.2021.104233
[38] Zeng, X., Wang, D., 2019. Hydration heat and microstructure of blended cements with coal gangue. Journal of Thermal Analysis and Calorimetry 138, 1129–1142. https://doi.org/10.1007/s10973-019-08118-8
[39] Zhang, J., Li, M., Zhou, Q., 2019. Freeze–thaw performance and pore-structure evolution of coal-gangue concrete. Construction and Building Materials 214, 180–190. https://doi.org/10.1016/j.conbuildmat.2019.04.091
[40] Zhang, X., Li, Z., Chen, W., 2023. Utilisation of calcined coal gangue as SCM: mechanical properties and microstructural characterisation. Cement and Concrete Research 168, 107194. https://doi.org/10.1016/j.cemconres.2023.107194
[41] Zhang, Y., Liu, J., 2025. Ductility enhancement of gangue-based concrete under confinement. Journal of Building Engineering 82, 108564. https://doi.org/10.1016/j.jobe.2025.108564
[42] Zhao, P., Li, W., 2022. Comparative microstructure and hydration mechanisms of fly ash and gangue blended concretes. Materials Characterization 191, 112135. https://doi.org/10.1016/j.matchar.2022.112135
[43] Zheng, L., Gao, Y., 2018. Compressive and tensile strength of concrete incorporating waste coal gangue powder. Construction and Building Materials 191, 501–510. https://doi.org/10.1016/j.conbuildmat.2018.09.021
[44] Zhou, Q., Han, J., 2023. Coupled chloride–carbonation durability of gangue–fly-ash blended concretes. Cement and Concrete Composites 145, 105229. https://doi.org/10.1016/j.cemconcomp.2023.105229
[45] Zhu, K., Zhao, Y., 2020. Influence of curing temperature on pozzolanic activity of coal gangue. Materials Today Communications 25, 101650. https://doi.org/10.1016/j.mtcomm.2020.101650
[46] International Energy Agency (IEA), 2023. The Role of Industrial Waste in a Just Transition. Paris, France. Available at: https://www.iea.org/
[47] United Nations Environment Programme (UNEP), 2024. Circular Economy and the Building Sector: Policy Roadmap. Nairobi, Kenya. Available at: https://www.unep.org/
As digital transformation accelerates across financial services and luxury markets, privacy and trust have become central concerns for high-net-worth individuals (HNWIs), ultra-high-net-worth clients (UHNWIs), and family offices. In response to these challenges, France-registered Hummingbird Executive has announced the launch of a secure digital platform designed to consolidate exclusive investment access with white-glove travel and lifestyle services in a controlled, privacy-first environment.
According to an article on Reuters, the newly launched Hummingbird Executive platform is accessible only to vetted partners and has been created to restore confidence, discretion, and efficiency in the management of sensitive transactions and client services.
Addressing Privacy Gaps in High-Value Transactions
High-net-worth individuals and family offices frequently operate across borders, asset classes, and service providers. Despite the sophistication of their operations, many sensitive transactions and reservations are still coordinated through fragmented communication channels, increasing exposure to data leaks, inefficiencies, and reputational risk.
Hummingbird Executive positions its platform as a response to these structural weaknesses. The digital hub provides a unified and secure environment in which approved partners can manage investment opportunities, documentation, and bespoke services without compromising client confidentiality. Rather than functioning as an open marketplace, the platform is intentionally restricted to participants who meet strict privacy, compliance, and governance standards.
This selective architecture reflects a broader shift in wealth management toward closed ecosystems built on long-term trust rather than scale-driven access.
Platform Architecture and Core Capabilities
At its core, the Hummingbird Executive platform combines secure communication, transaction coordination, and service orchestration. Approved partners are able to discreetly explore off-market investment opportunities while maintaining direct control over client data and identity.
Key platform functions include:
Access to curated investment products and off-market assets
Direct engagement with asset owners, legal advisors, and vetted professionals
Secure handling of documentation and communications under defined privacy protocols
By minimizing unnecessary intermediaries, the platform allows family offices and partner firms to streamline workflows while preserving discretion — a critical requirement for UHNW clients.
Guillaume Nardini, head of white-glove services at Hummingbird Executive, highlighted that the platform was designed to counter the growing reliance on unsecured tools in high-stakes environments. He noted that trusted partners can now deliver elevated services without sacrificing control over sensitive information.
Integration of White-Glove Travel and Lifestyle Services
Beyond investment and transaction management, Hummingbird Executive integrates a comprehensive suite of global travel and lifestyle services. These offerings are designed to complement financial operations by addressing the personal and logistical needs of high-net-worth clients through a single, coordinated interface.
Partners may extend these services to their clients, which include:
End-to-end travel arrangements, from commercial flights and private aviation to yachts, luxury hotels, and private villas
Lifestyle and concierge services, such as fine dining access, bespoke event planning, and local on-the-ground support
Centralized in-app communication for managing complex itineraries and individual requests through a single point of contact
Importantly, these services are delivered within the partner’s own relationship framework. This ensures that firms retain ownership of the client experience while leveraging Hummingbird Executive’s operational network and expertise.
Selectivity, Governance, and Partner Qualification
Access to the Hummingbird Executive platform is granted strictly by invitation or qualification. Prospective partners undergo a screening process that evaluates their commitment to confidentiality, regulatory compliance, and long-term relationship management.
This governance model is intended to foster a trusted ecosystem in which all stakeholders — including asset owners, family offices, and service providers — operate under shared standards of discretion and accountability. By limiting participation, the platform reduces operational risk while enhancing collaboration among vetted participants.
Such selectivity aligns with the expectations of high-net-worth clients, for whom privacy is not a feature but a foundational requirement.
Market Context and Strategic Relevance
The launch of Hummingbird Executive’s digital hub comes amid growing demand for secure, integrated solutions in wealth management and luxury services. Family offices increasingly seek platforms that can unify financial, lifestyle, and operational needs without exposing sensitive data across multiple vendors.
At the same time, regulatory scrutiny and cybersecurity concerns have intensified. These pressures have accelerated the adoption of purpose-built digital environments that prioritize data protection and controlled access over convenience-driven openness.
By combining technology, curated access, and concierge-level service delivery, Hummingbird Executive positions itself at the intersection of wealth management, private markets, and lifestyle orchestration — a segment characterized by high expectations and limited tolerance for risk.
Implications for Family Offices and UHNW Clients
For family offices, the platform offers a potential solution to long-standing coordination challenges. Centralized access to investment opportunities and services reduces operational complexity while supporting governance and reporting requirements.
For UHNW clients, the value proposition lies in discretion and continuity. By operating within a closed ecosystem, clients benefit from consistent service standards and reduced exposure to external threats, regardless of geography or asset type.
Conclusion
Hummingbird Executive’s secure digital hub represents an attempt to redefine how high-net-worth services are delivered in an increasingly interconnected yet risk-sensitive environment. Through selective access, integrated capabilities, and a strong emphasis on privacy, the platform addresses critical gaps in existing service models.
As demand for trust-based digital infrastructure continues to grow, solutions that prioritize discretion, governance, and long-term relationships are likely to play an expanding role in the global high-net-worth landscape.
Hailing from a modest middle-class family in India, Dr. Rahul Kumar Sharma’s early life was shaped by his father’s unwavering dedication to education. As a schoolteacher, Dr. Rahul Kumar Sharma father instilled in him the values of perseverance, intellectual curiosity, and a commitment to societal upliftment. From a young age, Dr. Rahul Kumar Sharma exhibited an extraordinary fascination with financial systems, captivated by the intricate interplay of numbers, market behaviors, and the mechanisms of wealth creation. This passion propelled him to pursue a rigorous academic path, culminating in a degree from IIT Bombay and a PhD in Finance from the prestigious Wharton School of Business.
At J.P. Morgan, Dr. Rahul Kumar Sharma’s expertise flourished as he became a prominent private fund manager and stock strategist, overseeing portfolios exceeding $6 billion. During this phase, he not only achieved financial independence but also gained firsthand exposure to the high-stakes, often ruthless dynamics of global capital markets. Yet, despite his international success, Dr. Rahul Kumar Sharma heart remained deeply rooted in India—a nation he felt had nurtured his journey and to which he owed a profound sense of responsibility.
Five years ago, Dr. Rahul Kumar Sharma made the pivotal decision to return to India, dedicating himself to mentoring retail investors. Through extensive interactions with thousands of individuals, he uncovered a disheartening trend: nearly 95% of Indian traders were losing money not due to lack of effort, but due to systemic barriers, outdated strategies, and limited access to institutional-grade knowledge. “Their aspirations are valid,” he asserts, “but the system favors the privileged.” Determined to bridge this gap, he authored The Secrets of Stocks, a groundbreaking manual designed to democratize financial literacy and empower everyday investors.
Key Insights from The Secrets of Stocks:
Decoding Institutional Market Manipulation Tactics: Reveals how large players exploit market asymmetries and how retail investors can recognize and counter these strategies.
Building Disciplined, Adaptive Trading Frameworks: Teaches risk-aware methodologies tailored to India’s volatile markets, emphasizing long-term sustainability over short-term gains.
Navigating India’s Unique Regulatory and Economic Landscape: Addresses challenges such as policy shifts, tax implications, and local market behaviors to help investors stay ahead.
Transforming Hard-Earned Capital into Sustainable Wealth: Provides actionable steps to align investment goals with personal financial aspirations, fostering confidence and clarity.
Dr. Rahul Kumar Sharma’s vision is unambiguous: to position The Secrets of Stocks as the most trusted guide for Indian retail investors, enabling them to reclaim control over their financial futures. “My purpose is to give back to the nation that shaped me,” he states, underscoring his belief that financial empowerment is a cornerstone of societal progress.
A Mission Rooted in Purpose
Dr. Rahul Kumar Sharma’s journey exemplifies the transformative power of knowledge. By merging his global expertise with an intimate understanding of India’s financial ecosystem, he has created a roadmap for retail investors to navigate complex markets with confidence. His work is not merely a book—it is a movement toward equitable financial literacy, where every individual, regardless of background, can harness the tools to build lasting wealth.
As he continues to expand his reach through workshops, mentorship programs, and digital platforms, Dr. Rahul Kumar Sharma remains steadfast in his mission: to ensure that the lessons of Wall Street are no longer the privilege of a few but the foundation for millions. “Knowledge is the ultimate equalizer,” he concludes. “With discipline, strategy, and the right guidance, every Indian investor can rewrite their financial destiny.”
In today’s fast-paced and dynamic world, technology is a driving force for innovation across all sectors, and education is no exception. Within the child care franchise industry, organizations like Celebree School are leading the way in harnessing digital advancements to provide enriched, high-quality early learning experiences. Technology is not viewed simply as an accessory but as a vital component in cultivating engaging, effective, and future-ready learning environments. This article explores the strategic integration of technology within a child care franchise setting and how it supports the developmental needs of young learners while ensuring operational excellence.
Interactive Learning Tools to Ignite Curiosity
A key benefit of technology within a child care franchise is the use of interactive learning tools. Celebree School, for example, incorporates digital resources—including tablets and age-appropriate educational software—that promote exploration, independence, and active participation. These tools are thoughtfully selected to capture and sustain children’s interest, encouraging curiosity and discovery through educational games and multimedia experiences. By integrating technology into daily activities, children have the opportunity to build foundational skills in literacy, mathematics, and critical thinking in ways that are both enjoyable and impactful. This technology-driven learning helps lay the groundwork for continued academic achievement.
Enhancing Communication and Collaboration
Clear and consistent communication is essential in any educational setting, and it is especially important in a child care franchise, where trust and collaboration between families and staff are paramount. Leading franchises utilize advanced technology platforms to bridge communication gaps, allowing parents to receive timely updates on their child’s progress, milestones, and daily experiences. This transparency not only builds confidence among parents but also increases engagement, enabling families to partner with educators and reinforce learning at home. As a result, technology strengthens the home-school connection, contributing to a holistic and cohesive approach to early childhood development.
Fostering Digital Literacy from an Early Age
In an era dominated by digital technology, it is vital to introduce children to digital literacy from an early age. Progressive child care franchises intentionally design their curricula to expose young learners to technology in responsible and age-appropriate ways. Activities might include guided use of educational apps, supervised exploration of interactive websites, and introductory coding exercises. These experiences help children develop confidence and familiarity with digital tools, which are increasingly important for future academic and professional success. By fostering digital literacy early, child care franchises prepare children to navigate and thrive in a technology-driven world.
Balancing Screen Time with Hands-On Experiences
Despite the many benefits technology brings to the classroom, leading child care franchises recognize the importance of maintaining a healthy balance between screen-based learning and hands-on, experiential activities. Celebree School, for instance, adopts a holistic educational philosophy that integrates technology with traditional forms of play and creative expression. Interactive whiteboards may be paired with storytelling and group discussions, while tactile activities such as art, building, and sensory play continue to play a central role in the curriculum. This balanced approach cultivates creativity, collaboration, and critical thinking, ensuring children develop a well-rounded set of skills without overreliance on digital devices.
Preparing for a Technologically Advanced Future
Strategic integration of technology within a child care franchise setting does more than enhance day-to-day learning; it also equips children with the adaptability and problem-solving skills essential for long-term success. Educators utilize technology to foster adaptability, resilience, and critical thinking—competencies that are increasingly valued in our rapidly changing society. By fostering a culture of curiosity and lifelong learning, franchises like Celebree School ensure that children are not only academically prepared but also confident and resourceful as they move forward in their educational journeys.
Conclusion
In conclusion, the thoughtful incorporation of technology within a child care franchise setting, such as that of Celebree School, yields significant benefits for young learners, families, and educators alike. Interactive tools, enhanced channels of communication, and a strong focus on digital literacy contribute to a dynamic and supportive environment where children are empowered to reach their full potential. By carefully balancing technological innovation with hands-on learning and social development, modern child care franchises are not only responding to current educational trends but also proactively preparing children for future academic and personal success. Embracing technology in this context is a deliberate, forward-thinking investment in the growth and development of the next generation.
Precision engineering is one of the most demanding fields in modern manufacturing. Whether producing intricate metal components for automotive systems, structural elements for construction, or tight-tolerance parts for industrial machinery, manufacturers must choose the right processing technology—one that offers accuracy, speed, repeatability, and cost efficiency.
Two technologies dominate this landscape: laser cutting and CNC machining. Each has evolved dramatically over the past decade, and both play essential roles in today’s production ecosystems. But how do they compare? Which applications suit each technology best? And how can manufacturers make the right decision for their workflow?
This article provides a clear, data-driven comparison to help businesses, engineers, and technical buyers make informed choices.
1. Understanding the Core Difference
Laser cutting and CNC machining rely on entirely different principles.
Laser Cutting
A high-powered laser beam melts, vaporizes, or burns material to create a clean, narrow cut line. Modern machines—especially fiber laser cutters—are fast, accurate, and optimized for metals like steel, aluminum, copper, and stainless steel.
Laser systems excel in:
Thin to medium-thickness materials
Complex shapes
Smooth edges
High-speed profiling
For example, manufacturers processing structural steel profiles often use specialized systems such as anH-shaped steel laser cutting machine, which combines accuracy with exceptional productivity.
CNC Machining
CNC machining removes material using mechanical tools such as mills, lathes, or drills. It is a subtractive manufacturing method that offers extremely tight tolerances and can create multi-dimensional features that laser cutting cannot.
CNC systems excel in:
Deep pockets
Threads
Chamfers
Multi-surface operations
High-precision 3D forms
Both technologies are powerful, but they shine in different scenarios—let’s explore those distinctions step by step.
2. Accuracy & Tolerance Comparison
Precision engineers focus heavily on tolerance, and this is where the comparison becomes interesting.
Laser Cutting Tolerance Levels
Modern industrial laser cutters typically achieve:
Fiber laser technology also reduces heat-affected zones, improving dimensional stability.
CNC Machining Tolerance Levels
High-end CNC machines can achieve:
±0.005 mm or better
Extremely tight tolerances on small components
Superior dimensional accuracy for complex geometries
Winner: CNC machining for ultra-high precision, but laser cutting provides more than enough precision for 95% of metal fabrication jobs.
3. Complexity of Geometry
Laser Cutting
A laser beam can move incredibly fast and change direction instantly, making it ideal for:
Complex outlines
Patterns and perforations
Sharp corners
Custom one-off designs
It’s particularly effective for 2D profiles, signage, metal architecture, and machine components.
CNC Machining
CNC machines can work in:
3-axis
4-axis
5-axis
They can produce 3D shapes, pockets, contours, and internal cavities—features impossible for laser cutting.
Conclusion: Laser = Best for 2D and high-speed profiling CNC = Best for 3D forms and multi-surface machining
4. Material Compatibility
Both technologies work with a broad range of metals, but their behavior varies.
Laser Cutting Materials
Ideal for:
Mild steel
Stainless steel
Aluminum
Copper & brass
Titanium
Laser cutting struggles only when thickness becomes excessive (typically above 40 mm depending on the laser power).
CNC Machining Materials
Works with:
Metals (steel, aluminum, brass, titanium)
Plastics
Composites
Wood
CNC machining handles extremely thick or hard materials that lasers cannot efficiently cut.
5. Speed & Workflow Efficiency
Laser Cutting
Extremely fast, especially on thin–medium materials
Minimal setup time
No clamping required in most cases
Batch production becomes highly efficient
A single operator can manage multiple laser machines at once, which helps factories reduce labor cost.
CNC Machining
Slower due to tool changes, spindle speeds, and material removal rates
Requires fixturing and setup
More operator supervision
Precision takes time
Winner: Laser cutting for high-volume or fast-turnaround jobs.
6. Surface Quality & Finishing Requirements
Laser Cutting Finish Quality
Clean edges
Very minimal burr
Little or no post-processing
No tool marks
This is especially valuable for industries where visual appearance matters—architecture, automotive interiors, decorative panels, and more.
CNC Machining Finish Quality
Excellent surface finish
Can produce mirror-like surfaces through polishing
Ideal for precision parts, molds, and engineering components
7. Cost Efficiency Comparison
Cost is often the deciding factor, and here’s how the two processes compare:
Cost Advantages of Laser Cutting
Faster cycle times
Lower labor requirement
Minimal consumables
Lower maintenance
High material utilization due to narrow kerf
Laser cutting is the most cost-effective choice for producing sheet metal parts.
Cost Advantages of CNC Machining
Invaluable for precision parts where dimensional accuracy is critical
Necessary for 3D forms
Tooling cost is higher, but the value is justified in complex applications
General Rule: Laser cutting = Lower cost for flat parts CNC machining = Higher cost but essential for complex engineering
8. Which Technology Should You Choose?
Choose Laser Cutting If:
You need fast production
You work mainly with sheet metals
Edge quality matters
Shapes are mostly 2D
You want minimal finishing work
Cost efficiency is important
You require architectural or industrial structural components
Laser cutting also supports specialized industrial needs—factories processing beams, pipes, or profiles rely on advanced laser systems such as those offered by Dowell Laser.
Choose CNC Machining If:
Your parts need ultra-tight tolerances
You require pockets, threads, counterbores, or multi-surface details
You need 3D geometry
You work with materials that are too thick or hard for laser cutting
Why Many Factories Use Both Technologies
In modern precision engineering, the smartest approach is hybrid production. Many manufacturers use:
Laser cutting for blanking, profiling, and preparing raw shapes
CNC machining for final finishing and tight-tolerance features
This combination significantly reduces overall production cost while maintaining high-precision output.
Example workflow:
Laser cuts the rough profile in seconds
CNC performs finishing on critical features
Final product achieves perfect accuracy with minimal waste
This hybrid method is widely used in automotive fabrication, construction steel processing, aerospace components, and machinery manufacturing.
Final Verdict
Laser cutting and CNC machining are not competitors—they are complementary technologies. Laser cutting dominates in speed, cost efficiency, and 2D profiling, while CNC machining excels in precision, 3D geometry, and finishing.
For most metal fabrication businesses, choosing both technologies is the fastest path to higher precision, lower production cost, and improved competitiveness.
If your factory is looking to upgrade production capability, modern high-power laser cutting systems offer one of the highest ROI levels in today’s manufacturing world—and integrating CNC machining afterward creates a complete, high-efficiency workflow.
Online dating has long ceased to be a novelty. Today, it is difficult to find someone who has never met someone online. At first, it was casual encounters on forums and social networks, then a targeted search for partners in special apps. Over the years, not only has the format of dating changed, but so have users’ expectations. Previously, they often relied on “chance”, and a beautiful photo and a few short phrases in a profile were enough to start a conversation. Today, users have become more discerning and conscious — they know exactly who they want to meet and why. And it is they who dictate the rules of online dating, not app developers.
What users expect in 2025
The main difference between today’s audience is a more conscious approach to choosing both a dating platform and a partner. People are no longer interested in just swiping; they want the acquaintance to continue in real life.
Here are the key expectations of modern users:
Authenticity. People want to see a real person in front of them, with their pros and cons. Photos that have been retouched beyond recognition are no longer attractive; on the contrary, they are repulsive. That is why developers are increasingly introducing the ability to see the other person live, for example, through video. This approach helps to avoid unpleasant surprises and mismatches between expectations and reality.
Quick transition to live communication. The pace of life has accelerated, and users no longer want to spend weeks chatting online, trying to figure out whether it is worth meeting in real life. More and more people are communicating via video to immediately assess how comfortable they are with each other and whether there is that special “chemistry”.
Simplicity. Users are tired of filling out questionnaires and don’t want to spend a lot of time creating a profile. That’s why services with the simplest possible interface are gaining popularity, where all you need to do to start communicating is press the “Start” button.
Security. People expect high-quality moderation and protection of personal data. This is a basic standard without which users do not want to stay on the platform. They want to be sure that their conversations are private, that their personal information is not used by third-party services, and that the risk of encountering fakes or bots is reduced to zero.
Video chats can meet all these expectations. And while the first chat roulettes were mainly used just to have fun, today such platforms are a full-fledged tool for finding a soul mate.
Why users choose video chats
The popularity of such services is a natural response to new needs. Today, people are less and less trusting of profiles that look too perfect. No one wants to waste their time communicating with fakes or people who are simply trying to pass off their desires as reality. The video format allows you to weed out such users in literally a few seconds. Platform moderators are interested in keeping them safe and comfortable. Therefore, they carefully monitor the atmosphere within and block anyone who violates the rules.
In addition, online video chats save time. There is no need to spend days on correspondence that may turn out to be useless. Most often, a short video conversation is enough to understand whether you want to continue communicating. After all, you see the person as they really are, without filters or masks. And while you can take time to “think” when writing, in video chats everything happens here and now. And you don’t have to guess the mood of the other person based on their writing style and emojis. Here, you can see their facial expressions, intonation, and gestures. And you can easily understand whether the person is interested in communicating or just keeping the conversation going out of politeness.
Another reason to use random video chat is the absence of swipes. More and more people are saying that they are tired of this format of dating. And this is not surprising, because sometimes all your free time is spent on swipes, and there is no time left to communicate. There is even a phenomenon known as the Netflix effect. Users endlessly scroll through profiles, trying to find the perfect candidate. And in the end, they never decide to start communicating with someone, because they are sure that somewhere out there on the internet there is someone better. In Kamchatka, communication begins immediately after connecting. The system selects conversation partners itself, and does so randomly. It is simply impossible to predict who will be on the other side of the screen. Therefore, in video chats, you can meet people you would never have met in real life or on the internet.
Platforms that deserve your attention
LuckyCrush is an online video chat that attracts users with its simplicity. There are no complicated settings: the interface is as intuitive as possible, and even a beginner can figure out how everything works. The platform allows you to choose the gender of your conversation partner and the language for comfortable communication. And if you don’t like the person, you can just click the “Next” button and the system will connect you with a new conversation partner in just a few seconds.
CooMeet.chat differs from LuckyCrushLive in that it has a gender filter, thanks to which men only communicate with women and vice versa. So if you’re interested in romantic encounters, this platform is what you need. In addition, every girl here must register and confirm her details. Therefore, the risk of encountering a fake or a bot is zero.
CooMeet.chat has other features that make communication more comfortable. For example, you can choose the language of communication and use the message translator if you decide to chat with a foreigner. Another interesting feature is Stories, which works the same way as on Instagram. You can record short videos or upload photos so that users can learn more about you before chatting. You can also view other people’s Stories. CooMeet.chat can be used on both a computer and a phone — in addition to the desktop version, there are convenient mobile apps for iOS and Android.
A new era of online dating
Modern dating apps are creating a new environment — one that is safer and more “lively”. The days when video chats were used by fakes and freaks are gradually becoming a thing of the past. Today, it is quite possible to find a soul mate on such platforms. The main thing is to be open to new acquaintances and not forget that on the other side of the screen are real people, not soulless avatars.