How to Extend Portable Power Station Runtime?

Extending portable power station runtime starts with using less energy, matching loads to battery capacity, and preparing reliable ways to recharge. Many users focus only on battery size, but actual backup time depends just as much on what you power, how you charge, and how efficiently the station operates between sessions. Small adjustments, such as turning off idle AC output, avoiding unnecessary devices, and planning solar or wall charging in advance, can add meaningful hours of use. With the right habits, you can get longer backup time without changing your core equipment at all.

6a6c0b955b9ae.webp

Reduce Energy Consumption to Maximize Runtime

Prioritize Essential Devices and Avoid Unnecessary Loads

The fastest way to extend runtime is to decide which devices truly matter. Start with essentials such as phones, lights, routers, medical equipment, or a small refrigerator, then disconnect comfort items that add steady drain without much value. High-wattage appliances, space heaters, and large cooking devices can empty a battery far faster than expected. It also helps to avoid plugging in chargers or electronics that remain in standby mode, because small phantom loads add up over several hours. Create a simple priority list before an outage or trip so you know what stays on first. That approach prevents waste and preserves power for the devices you actually need most.

Use Energy-Efficient Charging Methods and Settings

Charging devices efficiently can preserve more stored energy for longer use. Whenever possible, charge phones, tablets, cameras, and similar electronics through DC or USB outputs instead of running the inverter for small loads, since AC conversion introduces losses. Lower screen brightness, enable battery saver modes, and charge devices before they drop to critically low levels, because deep recharging multiple items at once increases demand. If your power station offers app-based monitoring, use it to spot inefficient usage patterns and adjust output settings in real time. The Anker app for the Anker SOLIX F3800 Plus Portable Power Station helps track charging, usage, and battery status, making it easier to reduce waste.

Optimize Portable Power Station Usage for Longer Backup Time

Understand Battery Capacity and Device Power Demands

Longer backup time begins with knowing how much energy your station stores and how quickly your devices consume it. Battery capacity is usually measured in watt-hours, while device demand is measured in watts. Divide usable watt-hours by the total running wattage to estimate runtime, then reduce that figure slightly to account for conversion losses. A 100-watt load will run far longer than a 1,000-watt appliance, even on the same unit. Check both running wattage and startup surges, especially for refrigerators, pumps, and tools. When you understand these numbers, you can rotate loads, avoid overloads, and make smarter decisions about what to power continuously versus only when needed.

Manage AC Output, Charging Cycles, and Standby Consumption

Portable power stations often lose energy through unnecessary inverter use, repeated partial charging habits, and standby draw from connected equipment. Turn on AC output only when you need to power AC devices, then switch it off afterward to reduce idle consumption. Unplug adapters, chargers, and appliances that continue drawing power even when they seem inactive. Try to group charging sessions instead of cycling the battery for many small, scattered tasks throughout the day. Fewer unnecessary cycles can support better long-term battery performance. It also helps to monitor output patterns regularly so you can catch waste early. Small operational changes like these often deliver noticeable runtime gains without changing battery size or usage goals.

6a6c0ba2642e7.webp

Improve Runtime Through Better Preparation and Maintenance

Plan Recharging Options Before Extended Use

Preparation matters as much as conservation when you need longer runtime. Before camping, road travel, or outage season, map out how and when you can recharge. Wall charging is often the fastest reset between uses, while solar can sustain longer off-grid operation if conditions are good. The Anker SOLIX F3800 Plus Portable Power Station supports up to 3,200W solar input with dual MPPT across an 11-165V range, allowing a full recharge in under 2 hours in optimal sunlight. It is also compatible with 240V AC wall outlets for faster recharging and 240V pure sine gas generators for extended outages, with 6,000W bypass support. Redundant charging options greatly improve uptime.

Store and Maintain the Power Station Properly

Good maintenance helps your power station deliver reliable runtime over the long term. Store it in a cool, dry place away from direct heat, freezing conditions, and excessive humidity, because temperature stress can reduce battery performance. If you will not use it for a while, keep the battery at a moderate state of charge rather than fully empty or permanently topped off. Check the unit periodically, recharge it as recommended, and inspect cables, ports, and ventilation openings for dust or damage. Keep firmware updated when applicable so charging behavior and system monitoring remain accurate. Consistent care protects battery health, supports stable output, and helps preserve expected backup time when you need it.

Conclusion

To extend portable power station runtime, focus on three things: reduce unnecessary consumption, use the station more efficiently, and prepare dependable recharging options. Prioritizing essential devices, limiting AC inverter use, and understanding watt-hour versus watt demand can quickly stretch available power. Better habits, such as avoiding standby losses and maintaining proper storage conditions, also support stronger long-term performance. When you pair smart daily operation with advance planning for wall, solar, or generator charging, your power station becomes far more dependable. Runtime is not only about battery size. It is the result of informed power management before, during, and after each use.

Daily writing prompt
Who is the fictional character you relate to the most?

How Does Weather Affect Solar Generator Performance?

Weather directly affects how well a solar generator charges, how much power it can deliver, and how reliably it supports your devices. Sunlight intensity, cloud cover, temperature, rain, dust, and seasonal daylight hours all influence solar panel output and battery performance. Bright, consistent sun produces the fastest charging, while overcast skies and short winter days reduce energy collection. Heat can also lower panel efficiency even when conditions look ideal. Understanding these effects helps you plan charging times, manage stored power, and protect equipment outdoors. With the right setup and habits, you can keep a solar generator performing more consistently through changing weather conditions year-round.

6a6c0b38a5383.webp

How Different Weather Conditions Influence Solar Charging Performance?

Sunlight, Cloud Cover, and Changes in Energy Generation

Sunlight is the main driver of solar charging performance. When panels receive direct, unobstructed sun, they generate the most electricity and charge a solar generator much faster. Cloud cover reduces irradiance, which lowers output, sometimes moderately under thin clouds and much more during dense overcast conditions. Early morning, late afternoon, shade, and low winter sun angles also cut production because panels receive weaker or less direct light. Seasonal differences matter too, since longer summer days provide more charging time than shorter winter days. A system such as the Anker SOLIX F3000 supports up to 2,400W solar input and can fully charge in under 2 hours with optimal sunlight.
Temperature, Rain, and Environmental Factors That Affect Output

Temperature has a more complex effect than many people expect. Solar panels need sunlight, but excessive heat can reduce their electrical efficiency, so output may dip on very hot days even under clear skies. Batteries are also sensitive to temperature extremes, with cold weather often slowing charging and reducing available capacity temporarily. Rain lowers charging by blocking strong sunlight, though light rain can help wash dust and pollen from panel surfaces. Humidity, haze, smoke, and airborne debris can also limit the amount of light reaching the cells. Wind may cool hot panels and slightly improve performance, while accumulated dirt, snow, or leaves can physically block sunlight and reduce output.

Ways to Maintain Reliable Solar Generator Performance in Changing Weather

Optimizing Solar Panel Placement and Charging Conditions

Good panel placement helps offset changing weather and improves charging consistency. Position panels where they receive the longest period of direct sunlight and avoid shade from trees, vehicles, tents, or rooflines, even for part of the day. Adjust the tilt angle to match the sun’s seasonal path so more light hits the panel surface directly. If possible, reposition portable panels as the sun moves rather than leaving them flat. Keep panels clean, since dust, pollen, and bird droppings reduce light absorption. During hot weather, allow airflow beneath the panels to limit heat buildup. In variable conditions, start charging early so you capture available sunlight before clouds or storms arrive.

Managing Battery Use During Limited Solar Availability

When sunlight is limited, smart battery management becomes just as important as charging conditions. Prioritize essential loads first, such as phones, medical devices, lights, or communication equipment, and delay high-wattage appliances until solar input improves. Track battery percentage regularly so you can adjust usage before levels become critical. Charging devices during peak sun hours helps reduce strain on stored energy. If your solar generator supports multiple charging methods, recharge from wall power before a storm or extended cloudy period when possible. Lowering unnecessary standby consumption also extends runtime. By matching energy use to expected weather and available input, you can maintain more stable power through cloudy, rainy, or short winter days.

6a6c0b43b3e93.webp

Preparing Solar Generators for Outdoor and Seasonal Conditions

Protecting Equipment From Weather Exposure and Storage Issues

Outdoor use requires protecting both the generator and the solar panels from direct weather exposure. Keep the power station on a dry, stable surface and avoid placing it in standing water, mud, or heavy rain unless the unit and connections are specifically protected. Use covered areas or weather-aware placement that still allows safe cable routing to the panels. After wet, dusty, or sandy conditions, wipe down panels and inspect ports, connectors, and cables for buildup or corrosion. For seasonal storage, keep the unit in a cool, dry place and maintain a partial charge level according to the manufacturer’s guidance. Proper storage helps preserve battery health and ensures dependable performance when needed again.

Planning Energy Needs Around Local Weather Patterns

Reliable solar generator use improves when you plan around the weather patterns common in your area. In sunny regions, you can often schedule charging during predictable midday peaks and rely more heavily on solar input. In places with frequent cloud cover, storms, or long winters, build in extra charging time and maintain a larger energy reserve. Check forecasts before camping trips, outdoor work, or backup power use at home so you know when to charge fully in advance. Estimate daily energy needs realistically and include a buffer for reduced output during poor conditions. Matching your power plan to local climate helps prevent shortfalls and makes solar energy more dependable throughout the year.

Conclusion

Weather affects solar generator performance in clear, practical ways. Strong direct sun delivers the fastest charging, while clouds, shade, short days, dirt, and precipitation reduce energy generation. High heat can lower panel efficiency, and cold temperatures can affect battery behavior. The best results come from combining good panel placement, routine cleaning, careful battery management, and weather-aware planning. Protecting equipment from exposure and storing it correctly also supports long-term reliability. If you understand how local conditions influence charging and output, you can use a solar generator more effectively and maintain dependable power for travel, outdoor work, emergency backup, and everyday off-grid needs.

Daily writing prompt
Who is the fictional character you relate to the most?

The Battery Math Behind Going Off-Grid

Ask ten installers how many batteries a house needs and you’ll get ten answers, because the honest reply is “it depends.” What it depends on is easier to pin down than most people expect: how much electricity the home burns through, how many sunless days it has to carry on its own, and whether it’s cutting the cord for good or just building a cushion against outages. The average American home runs through roughly 29 kilowatt-hours a day, according to the U.S. Energy Information Administration — and that one number is where every sizing decision begins.

Two different problems, two different answers

Going off-grid means no utility connection at all. The battery bank, paired with solar, has to supply every kilowatt-hour the household uses, in February as well as July, through whatever stretch of bad weather shows up. A home microgrid, by contrast, is a self-contained system that can run on its own but stays tied to the utility — islanding during an outage, then leaning on the grid the rest of the time.

That distinction drives the battery count more than any spec sheet. An off-grid bank has to survive the worst week of the year; a microgrid only has to bridge the gaps. The same house can need four times the storage under the first scenario as under the second, which is why modular battery systems that stack as needs grow tend to suit both jobs — owners add capacity to match the goal instead of guessing up front.

The one formula that does the work

Battery sizing comes down to a single line: daily use × days of autonomy ÷ depth of discharge = the capacity to install.

“Days of autonomy” is how long the batteries can power the home with zero solar coming in — most off-grid designers plan for two to three. “Depth of discharge” is the share of a battery’s rated capacity that’s safe to actually use; lithium iron phosphate (LFP) chemistry handles around 90 percent, where older lead-acid tops out near half.

Autonomy days exist because sunshine isn’t steady. Production-modeling data from the National Renewable Energy Laboratory shows how sharply solar output can fall between a clear summer afternoon and a gray winter week — the reason an off-grid system has to bank far more than a single day’s worth.

What the numbers look like for a real house

Run the 29-kilowatt-hour home through both scenarios.

SetupWhat it coversCapacity to installApprox. modules
Fully off-gridWhole home, ~3 days~97 kWh10–12
Grid-tied microgridCritical loads, ~1 day~13 kWh2–3

Off the grid, three days of full coverage works out to about 97 kWh of installed capacity. With 9-kWh LFP modules — the BAT 9.0 packs in a SigenStor build, for instance — that comes to roughly eleven of them, or two stacks, since a single stack tops out near 54 kWh.

A microgrid is a different story. Most homeowners back up only what matters during an outage: the refrigerator, lights, internet, a well pump, maybe a furnace blower. That’s a fraction of the daily total, so two or three modules on a single stack usually cover it. A unit like the Sigen LoadHub decides which circuits stay live and switches over in milliseconds, so the household barely notices the cutover.

The takeaway is simple: there’s no universal battery count, only the right one for a clearly defined goal. Pinning down daily use and autonomy days first — then choosing solar battery storage sized to match — avoids both the cold, dark mornings of an undersized bank and the wasted money of an oversized one. For anyone weighing the two paths, modeling the load before any hardware gets ordered is the step that pays off most.

Daily writing prompt
Who is your favorite blogger to follow?

Well Pump Installation vs Diy: Factors to Consider for Eastern Oregon Residents

For rural homeowners in Eastern Oregon, reliable access to water is a fundamental necessity. Selecting the right well pump contractor can make a significant difference in the quality and reliability of your home’s water supply. Choosing the right contractor is essential for well pump installation Eastern Oregon.

While a DIY approach may seem cost-effective, certain factors like the region’s topography and climate necessitate professional expertise. Below, we will explore how to choose the right well pump contractor and what to consider for a successful well pump installation in Eastern Oregon.

Assessing Eastern Oregon’s Unique Well Water Challenges

Rural Eastern Oregon presents unique challenges for well pump installation due to its diverse geography, which can range from arid deserts to mountainous terrain. Such variations impact well depth, water quality, and the type of pump system required.

For instance, some areas may have high mineral content in the water supply, which requires specialized filtration systems to ensure water quality. In areas with extreme seasonal temperature variations, well components must be resistant to freezing and other weather-related stresses.

When choosing a contractor for well pump installation Eastern Oregon, homeowners should seek professionals with experience in addressing these regional characteristics. A knowledgeable contractor will evaluate the specific conditions of your property to recommend the appropriate well pump system.

Professional Well Pump Installation: Ensuring Safety and Efficiency

Professional well pump installation is vital for ensuring that your water system functions safely and efficiently. Contractors bring technical expertise and understand the importance of adhering to Eastern Oregon’s environmental regulations and building codes.

A licensed well pump installer will also be versed in the latest energy-efficient technologies and can recommend the correct pump size to meet your household needs while conserving energy. This expertise ensures that your well pump system operates at peak performance with minimal environmental impact.

Additionally, professionals carry insurance that protects you from any liabilities during the installation process. For both safety and efficiency, a reputable well pump contractor is indispensable for a long-lasting and compliant water system.

DIY Well Pump Installation: Skills and Tools Required

While the idea of DIY well pump installation might be tempting, it requires a broad set of skills and the right tools that most property owners may not possess. From understanding the geology beneath your property to electrical knowledge for the pump’s power supply, it’s a complex task.

DIY enthusiasts must also invest in specialized equipment, which can be costly and only occasionally used. Without the proper tools and expertise, one risks damaging the pump or injuring themselves during the installation process.

Before deciding on a DIY approach, consider the time investment required for learning and the potential risks. It may quickly become evident that hiring a professional contractor for well pump installation Eastern Oregon is the safer and more efficient choice.

Making the Decision: Cost-Benefit Analysis for Homeowners in Eastern Oregon

A well pump is a long-term investment for any homeowner, and its cost must be weighed against the benefits it delivers. Understanding the full spectrum of expenses, from initial installation to ongoing maintenance and potential repairs, is essential.

In rural Eastern Oregon, where professional services may come at a premium due to accessibility and transportation costs, homeowners should also factor in the value of a contractor’s regional expertise. This expertise can lead to more durable and trouble-free well pump operation, ultimately saving money.

Conduct a thorough analysis considering both the immediate and long-term financial implications of professional versus DIY well pump installation. Look beyond the price tag and think about reliability, efficiency, and peace of mind that a professional service can offer.

Ultimately, while a DIY well pump installation may seem like an opportunity to save money, the specific challenges and needs in rural Eastern Oregon often necessitate professional expertise. Weighing the risks and benefits with a focus on long-term performance and safety is key for homeowners making this critical decision. By choosing a well-informed contractor, residents can secure a reliable and efficient water supply for their homes.

Daily writing prompt
What Olympic sports do you enjoy watching the most?

When Moving Office Locations Proper Us Storage Is Essential?

Moving an office is a massive undertaking that challenges even the most organized businesses. Statistics reveal that the cost of downtime during a move can average $5,600 per minute, underlining the importance of efficiency. Utilizing proper U.S. storage solutions can significantly mitigate these costs by ensuring your inventory, equipment, and documents are securely managed during the transition.

Recognizing the right storage options is pivotal in minimizing operational disruptions during an office relocation. Below, we’ll explore the essential steps and strategies for securing the optimal storage solutions that align with your business needs and ensure a smooth move.

Planning Your Office Move: Securing the Right Storage Solutions

Photo by Yan Krukau on Pexels.com

When it comes to moving an office, the security and accessibility of your items are non-negotiable. Choosing the right storage solution can be the difference between a seamless transition and a logistical nightmare. In the planning phase, it’s vital to understand the volume and nature of the items to be stored, as well as the duration of storage necessary.

Considering factors such as climate control, location, and space flexibility can safeguard your assets from damage and deterioration. For example, sensitive electronic equipment and important documents may require climate-controlled storage to maintain their integrity. Moreover, evaluating the storage facility’s accessibility ensures that you can retrieve items as needed without delays.

Conduct thorough research or consult with us storage storage experts to ascertain the best fit for your company’s unique needs. Look for providers with scalable solutions that can accommodate both short-term excess during the move and longer-term storage for items not immediately needed in the new space.

Navigating the Challenges of Office Relocation: Storage Strategies

Relocating an office involves multiple moving parts, and establishing a clear storage strategy can streamline the process. Prioritization is key: decide which items need to be moved first based on their importance to business operations or setup requirements at the new location.

Create an inventory list categorized by “necessary for immediate operation,” “required short-term,” and “non-essential.” This classification enables better allocation of storage resources, ensuring high-priority items are moved and set up with minimal delay. Leveraging a modular storage system can offer you the flexibility to adapt spaces as needed throughout the move.

For actionable guidance, implement a detailed labeling system and consider storage units with advanced inventory management systems. These can encompass barcode tracking or even RFID technology to keep a handle on assets during a tumultuous moving process.

Ensuring Business Continuity: The Role of Storage in Office Moves

The primary goal during any office move is to maintain business continuity to the highest degree possible. Effective use of storage solutions can act as a buffer against operational downtime, preserving the flow of business activities.

Storing non-essential items in advance of the move can declutter the working environment and reduce the risk of lost productivity. This approach also helps to lower the potential for asset loss or damage by reducing last-minute packing and handling. It’s important to work with a storage provider that offers secure, reliable protection for your goods throughout the relocation process.

Arrange for critical equipment and files to be readily available when the new office is operational. Chose a storage provider that can guarantee quick, organized retrieval systems, minimizing delays in re-establishing full business operations at your new location.

Selecting a Storage Partner for Your Office Transition

Photo by Matheus Bertelli on Pexels.com

Selecting the right storage partner is paramount for a successful office move. Look for a provider that has a proven track record in assisting with commercial relocations and understands the specific challenges that businesses face during this process.

Assess the potential storage partner’s security measures, insurance options, and additional services such as transport and on-demand retrieval. These factors greatly contribute to the peace of mind that comes with knowing your company’s assets are in safe hands. The provider should also offer transparent pricing models to avoid any unexpected costs that could strain your moving budget.

In this pursuit, seek testimonials or case studies from previous clients to gauge the provider’s reliability and efficiency. Opting for a partner with dedicated customer support ensures you have assistance readily available throughout your office’s transition period.

Overall, a meticulously planned storage strategy plays a critical role in ensuring a smooth office relocation. By prioritizing storage solutions that align with specific business needs, establishing an effective inventory management system, and selecting a reliable storage partner, businesses can significantly reduce the risks and costs associated with moving. Tailored storage options not only aid in operational continuity but also provide the necessary safeguards to protect your valuable assets throughout the transition.

Daily writing prompt
What Olympic sports do you enjoy watching the most?

India’s Evolving Role in Environmental Protection: A Study in Post-Globalization Era

Daily writing prompt
What is your favorite drink?

Citation

Papparaya, & Yatanoor, C. M. (2026). India’s Evolving Role in Environmental Protection: A Study in Post-Globalization Era. International Journal of Research, 13(1), 599–607. https://doi.org/10.26643/ijr/2026/v13i1-2

Papparaya

Research Scholar

Department of Political Science

Gulbarga University, Kalaburagi, 585 106

Karnataka

papparaya123@gmail.com

Prof. Chandrakant. M. Yatanoor

Senior Professor & Chairman

Department of Political Science

Gulbarga University, Kalaburagi, 585 106

Karnataka

cmyatanoor@rediffmail.com

Abstract:

         The advent of globalization, particularly following India’s economic liberalization in 1991, has presented a complex and often contradictory set of challenges and opportunities for the nation’s environmental governance. This paper examines India’s evolving role in environmental protection in this transformative period. It argues that globalization has acted as a dual-edged sword, concurrently accelerating environmental degradation through rapid industrialization and consumerism, while also providing access to green technologies, international finance, and a platform for global environmental diplomacy. The paper analyses the trajectory of India’s domestic environmental policy, highlighting the critical role of judicial activism and the strengthening of legal and institutional frameworks, such as the National Green Tribunal. It further explores India’s transition on the international stage from a cautious participant to a proactive leader, exemplified by its instrumental role in the Paris Agreement and the launch of initiatives like the International Solar Alliance (ISA). Despite these advancements, significant challenges persist, including a persistent gap between policy formulation and implementation, the contentious development-versus-environment debate, and acute vulnerability to climate change. The paper concludes that India’s future role is pivotal; its ability to successfully navigate the intricate nexus of economic growth and ecological sustainability will not only determine its own developmental trajectory but also have profound implications for global environmental security.

Keywords: Globalization, Environmental Protection, India, Sustainable Development, Climate Change, Environmental Policy, Judicial Activism, International Solar Alliance (ISA).

Introduction:

           The process of globalization, characterized by the accelerated integration of economies, cultures, and societies, has fundamentally reshaped the global environmental landscape. For developing nations, this integration has been a catalyst for unprecedented economic growth, but it has often come at a significant ecological cost1. India, since its economic liberalization in 1991, stands as a prime case study of this complex dynamic. As one of the world’s fastest-growing major economies and its most populous nation, India’s developmental pathway and its approach to environmental stewardship carry immense global weight. The post-globalization era has forced India to confront a dual reality: the pressures of resource-intensive growth and pollution on one hand, and the opportunities for international collaboration and technological advancement in sustainability on the other2.

           Before 1991, India’s environmentalism was largely shaped by domestic concerns, culminating in foundational legislation like the Water (Prevention and Control of Pollution) Act, 1974, the Air (Prevention and Control of Pollution) Act, 1981, and the comprehensive Environment (Protection) Act, 1986, which was enacted in the aftermath of the Bhopal gas tragedy3. However, the post-1991 economic reforms unshackled the industrial sector, attracted Foreign Direct Investment (FDI), and integrated India into global supply chains. This unleashed economic forces that placed immense strain on the country’s natural resource base and its nascent regulatory capacity.

          Now, it is essential to examine India’s evolving role in environmental protection since 1991. It reveals that India’s journey has been one of adaptation and transformation, characterized by a reactive strengthening of domestic policy in response to escalating environmental crises and a gradual, yet decisive, shift towards a leadership role in global environmental diplomacy. This paper analysed the dual impacts—negative and positive—of globalization on India’s environment. It will then trace the evolution of the nation’s domestic legal and institutional frameworks, with a special focus on the crucial role of judicial activism. Subsequently, India’s engagement in international environmental forums is discussed. The persistent challenges and future prospects for sustainable development in India are also analysed.

The Dual Impact of Globalization on India’s Environment

         Globalization’s effect on India’s environment is not monolithic; it has simultaneously been a source of degradation and a catalyst for positive change.

A. Negative Externalities and Accelerated Degradation

          The most visible consequence of economic liberalization was the rapid pace of industrialization and urbanization. The drive to attract investment and boost manufacturing output often led to the relaxation of environmental oversight, creating “pollution havens” in certain industrial clusters4. This resulted in:

  1. Increased Pollution: Air and water pollution levels surged. The proliferation of thermal power plants, vehicular emissions in rapidly growing cities, and untreated industrial effluents from sectors like textiles, tanneries, and chemicals have led to a severe public health crisis. A 2020 report noted that 22 of the world’s 30 most polluted cities were in India, with Particulate Matter (PM2.5) concentrations far exceeding World Health Organization (WHO) guidelines5.
  2. Resource Depletion: The demands of a globalized economy have intensified pressure on India’s natural resources. Deforestation for mining, infrastructure projects, and industrial agriculture has accelerated. Water tables have plummeted due to unsustainable extraction for both agriculture and industry, leading to acute water stress in many parts of the country6.
  3. Consumption Patterns and Waste Management: Globalization introduced global brands and fostered a culture of consumerism. This, coupled with rapid urbanization, has led to a monumental increase in municipal solid waste, plastic waste, and electronic waste (e-waste). The infrastructure for managing this waste has failed to keep pace, resulting in overflowing landfills, polluted water bodies, and informal, hazardous recycling practices7.

B. Positive Opportunities and Catalysts for Change

           Despite these severe negative impacts, globalization has also provided pathways for environmental improvement.

  1. Access to Green Technology and Finance: Integration with the global economy has facilitated the transfer of cleaner and more efficient technologies. India has become one of the world’s largest markets for renewable energy, driven by falling costs of solar panels and wind turbines, largely imported or produced with foreign technology. Furthermore, international financial mechanisms, such as the Green Climate Fund and FDI in sustainable projects, have provided crucial capital for India’s green transition8.
  2. Enhanced Global Awareness and Civil Society: Globalization has connected Indian environmental movements with international networks. This has amplified the voices of non-governmental organizations (NGOs) and civil society groups, enabling them to exert greater pressure on the government and corporations. Global norms and standards regarding environmental protection and corporate social responsibility have slowly begun to influence domestic policy and corporate behavior9.
  3. Pressure from International Markets: As Indian companies became more integrated into global supply chains, they faced increasing pressure from international buyers and consumers to adhere to higher environmental and labour standards. This has incentivized some export-oriented industries to adopt cleaner production processes and obtain international certifications like ISO 14001.

The Evolution of Domestic Environmental Governance

         In response to the escalating environmental crises of the post-globalization era, India’s domestic governance framework underwent a significant, albeit often reactive, evolution, driven primarily by judicial intervention and subsequent legislative action.

(i) The Era of Judicial Activism

           Perhaps the most significant development in Indian environmental jurisprudence has been the proactive role of the judiciary. Through Public Interest Litigations (PILs), the Supreme Court of India and various High Courts have expanded the interpretation of the Constitution to protect the environment. The court declared that the “Right to Life” under Article 21 of the Constitution includes the right to a clean and healthy environment10. This principle became the basis for numerous landmark judgments:

  • In the M.C. Mehta v. Union of India series of cases, the Supreme Court issued directives on controlling pollution in the Ganga River, relocating polluting industries from Delhi, and mandating the use of Compressed Natural Gas (CNG) for public transport in the capital11.
  • The judiciary established key environmental principles in Indian law, including the “precautionary principle,” the “polluter pays principle,” and the doctrine of “public trust,” which holds that the state is a trustee of natural resources for the public12.

           This judicial activism filled a critical void left by executive and legislative inertia, compelling the government to act on pressing environmental issues.

(ii) Strengthening of Institutional and Legal Frameworks

           Prompted by judicial orders and growing public pressure, the government strengthened its institutional architecture.

  1. The National Green Tribunal (NGT): A landmark development was the establishment of the National Green Tribunal in 2010. The NGT is a specialized judicial body equipped with expertise to handle environmental cases effectively and expeditiously. It has delivered several impactful judgments, including bans on old diesel vehicles, regulations on sand mining, and penalties for environmental violations, establishing itself as a powerful environmental watchdog13.
  2. New Policies and Regulations: The post-globalization era saw the introduction of a new suite of environmental regulations targeting specific problems. These include the E-Waste (Management) Rules, 2016; Plastic Waste Management Rules, 2016; and Solid Waste Management Rules, 2016. The National Environment Policy (2006) was formulated to mainstream environmental concerns into all development activities14.
  3. Environmental Impact Assessment (EIA): The EIA notification, first issued in 1994 and subsequently amended, made environmental clearance mandatory for a wide range of development projects. However, the EIA process has been a subject of intense debate, with critics arguing that recent amendments, such as the draft EIA Notification 2020, have sought to dilute environmental safeguards in favor of promoting “ease of doing business”15.

India on the Global Stage: International Environmental Diplomacy

            India’s role in international environmental negotiations has transformed significantly. Initially, its stance was defensive, strongly advocating for the principle of “Common But Differentiated Responsibilities and Respective Capabilities” (CBDR-RC) to emphasize the historical responsibility of developed nations for climate change and to protect its own “right to develop”16. While this principle remains a cornerstone of its foreign policy, India’s approach has become more proactive and solution-oriented.

A. Leadership in Climate Action: The Paris Agreement

         At the 2015 Paris Climate Conference (COP21), India played a crucial role as a bridge between developed and developing nations, helping to forge the final consensus. It submitted ambitious Nationally Determined Contributions (NDCs), which included:

  • Reducing the emissions intensity of its GDP by 33-35% by 2030 from 2005 levels.
  • Achieving about 40% of cumulative electric power installed capacity from non-fossil fuel-based energy resources by 2030.
  • Creating an additional carbon sink of 2.5 to 3 billion tonnes of CO2 equivalent through additional forest and tree cover by 2030.

           At COP26 in Glasgow (2021), India further enhanced these commitments, pledging to achieve net-zero emissions by 2070 and setting a target of 500 GW of non-fossil fuel energy capacity by 203017.

B. Proactive Multilateral Initiatives

           Beyond its commitments, India has launched major international initiatives, positioning itself as a leader of the Global South in the green transition.

  1. International Solar Alliance (ISA): Co-founded by India and France in 2015, the ISA is a treaty-based intergovernmental organization that aims to mobilize technology and finance to promote the widespread deployment of solar energy. With over 120 signatory countries, the ISA is a testament to India’s vision of “one sun, one world, one grid” and its leadership in climate solutions18.
  2. Coalition for Disaster Resilient Infrastructure (CDRI): Launched by India at the 2019 UN Climate Action Summit, the CDRI is a multi-stakeholder global partnership that aims to promote the resilience of new and existing infrastructure systems to climate and disaster risks. This initiative addresses a critical adaptation need for developing countries19.

These initiatives signal a strategic shift in India’s role from being a mere rule-    mntaker in global environmental governance to an active agenda-setter.
Challenges and Future Directions

           Despite significant progress in policy formulation and international diplomacy, India faces formidable challenges in translating its ambitions into on-the-ground reality.

  1. The Implementation Gap: A chasm persists between India’s well-formulated environmental laws and their enforcement. State Pollution Control Boards (SPCBs) and other regulatory bodies are often underfunded, understaffed, and susceptible to political and corporate influence. This results in widespread non-compliance and continued environmental degradation20.
  2. Development vs. Environment Dichotomy: The tension between achieving rapid economic growth and ensuring environmental protection remains a central political challenge. The government has often been accused of prioritizing industrial and infrastructure projects by diluting environmental regulations, as seen in the controversies surrounding forest clearances and the EIA process.
  3. Climate Change Vulnerability: India is one of the country’s most vulnerable to the impacts of climate change, including extreme weather events, sea-level rise, and water scarcity. Adapting to these impacts will require massive investment and planning, diverting resources that are also needed for mitigation and poverty alleviation21.
  4. Resource Inefficiency and Circular Economy: India’s economy is still highly resource-intensive. Transitioning to a circular economy model, which emphasizes resource efficiency, recycling, and waste minimization, is crucial but remains in its nascent stages.

         In the future, India’s role will be defined by its ability to address these challenges. Key priorities must include strengthening regulatory institutions, investing in enforcement capacity, mainstreaming sustainability into economic planning, and fostering public participation in environmental decision-making.

Conclusion:

          The era of globalization has profoundly shaped India’s environmental trajectory, presenting it with a formidable set of problems and a unique array of opportunities. The pressures of a rapidly growing, market-integrated economy have undeniably exacerbated pollution, resource depletion, and ecological stress. However, this same period has seen the rise of a powerful and independent judiciary, the creation of a sophisticated legal framework, and the emergence of India as a credible and influential voice in global environmental diplomacy.

           India’s role is inherently paradoxical: it is a major contributor to global environmental challenges, yet it is also a source of innovative, large-scale solutions, particularly in the renewable energy sector. Its leadership through platforms like the ISA and CDRI demonstrates a clear intent to shape a more sustainable global future. The ultimate test, however, lies in its domestic performance. Bridging the gap between policy and practice, resolving the conflict between short-term economic gains and long-term ecological security, and building a truly sustainable development model are the defining challenges for India in the 21st century. The success or failure of this endeavour will not only determine the well-being of its 1.4 billion citizens but will also be a critical factor in humanity’s collective effort to secure a viable planetary future.

References:

  1. J. A. Frankel, “The Environment and Globalization,” in Globalization: What’s New, M. M. Weinstein, Ed. New York: Columbia University Press, 2005, pp. 129-169.
  2. E. S. Somanathan and R. S. Kumar, “Environmental Policy in India: A Review,” in A Companion to the Indian Economy, P. Basu, Ed. Hoboken, NJ: Wiley-Blackwell, 2011, pp. 491-508.
  3. S. Divan and A. Rosencranz, Environmental Law and Policy in India: Cases, Materials and Statutes, 2nd ed. Oxford: Oxford University Press, 2001.
  4. S. Murty, B. N. Kumar, and M. Paul, “Environmental Regulation, Productive Efficiency and Abatement Cost in Indian Cement Industry,” Ecological Economics, vol. 59, no. 1, pp. 123-134, Aug. 2006.
  5. IQAir, World Air Quality Report 2020: Region & City PM2.5 Ranking, 2021. [Online]. Available: https://www.iqair.com/world-air-quality-report
  6. NITI Aayog, Composite Water Management Index, Government of India, New Delhi, Jun. 2018.
  7. Central Pollution Control Board (CPCB), Annual Report 2018-19 on Implementation of Solid Waste Management Rules, 2016, New Delhi: Ministry of Environment, Forest and Climate Change, 2019.
  8. International Energy Agency (IEA), India Energy Outlook 2021, Paris: IEA, Feb. 2021.
  9. A. Kothari, “Environment and Globalization: A View from India,” Development, vol. 48, no. 2, pp. 81-86, Jun. 2005.
  10. P. Leelakrishnan, Environmental Law in India, 4th ed. New Delhi: LexisNexis, 2016.
  11. M. C. Mehta v. Union of India, (1987) 1 SCC 395 (Oleum Gas Leak Case).
  12. L. Rajamani, “The Right to a Healthy Environment in India: The Judiciary’s Role,” Review of European, Comparative & International Environmental Law, vol. 11, no. 2, pp. 175-184, Jul. 2002.
  13. G. P. Wilson, “India’s National Green Tribunal: A Robust Environmental Court,” Journal of Environmental Law, vol. 27, no. 1, pp. 131-143, Mar. 2015.
  14. Ministry of Environment, Forest and Climate Change (MoEFCC), National Environment Policy, 2006, Government of India, New Delhi, 2006.
  15. K. C. S. Kartha and L. V. Kumar, “Dilution of Environmental Norms: An Analysis of the Draft EIA Notification 2020,” Economic and Political Weekly, vol. 55, no. 34, pp. 10-13, Aug. 2020.
  16. N. Dubash, “The Politics of Climate Change in India: Narratives of Equity and Co-benefits,” Wires Climate Change, vol. 4, no. 3, pp. 191-201, May/Jun. 2013.
  17. Government of India, India’s Updated First Nationally Determined Contribution Under Paris Agreement (2021-2030), submitted to UNFCCC, Aug. 2022. [Online]. Available: https://unfccc.int/NDCREG
  18. International Solar Alliance, About ISA, [Online]. Available: https://isolaralliance.org/about/
  19. Coalition for Disaster Resilient Infrastructure, About CDRI, [Online]. Available: https://www.cdri.world/about-cdri
  20. S. Narain, “The Challenge of Implementation in India’s Environmental Governance,” in The Oxford Handbook of the Indian Economy, C. Ghate, Ed. Oxford: Oxford University Press, 2012, pp. 603-625.
  21. Inter-governmental Panel on Climate Change (IPCC), “Climate Change 2022: Impacts, Adaptation and Vulnerability,” Contribution of Working Group II to the Sixth Assessment Report of the Intergovernmental Panel on Climate Change, Cambridge University Press, 2022.

Prospects of Geographic Information System and Multi-Source Data Integration in Enhancing the Accuracy of Above-Ground Biomass and Carbon Stocks Estimation

Daily writing prompt
Write about a few of your favorite family traditions.

Citation

Omali, T. U., Akpata, S. B. M., & Onyevu, R. O. (2026). Prospects of Geographic Information System and Multi-Source Data Integration in Enhancing the Accuracy of Above-Ground Biomass and Carbon Stocks Estimation. International Journal of Research, 13(1), 484–492. https://doi.org/10.26643/ijr/2026/23

Omali, Thomas Ugbedeojo (PhD)1*; Akpata, Sylvester Balm Mifue2 (PhD);

Onyevu, Rosemary Onyinye (MSc.)3

1National Biotechnology Development Agency (NABDA), Abuja, Nigeria.

2Department of Geoinformatics and Surveying, University of Abuja, Nigeria

3Department of Geoinformatics and Surveying, University of Nigeria, Nsukka, Nigeria.

Corresponding Author’s Email Id: t.omali@yahoo.com

Abstract

Evaluating Above-Ground Biomass (AGB) accurately and the successive calculation of carbon stocks are fundamental process for understanding the global carbon cycle, climate change mitigation and sustainable forest management. The traditional field-based methods for AGB and carbon stocks assessment is effective; but then, they involve more cost, time, and they are not scalable to a large area. Thus, the utilization of cutting-edge technology to support the conventional approach is expedient. This study is a mini review that discuss the prospects of Geographic Information System (GIS) and the need to integrate various data in evaluating AGB and carbon stocks. First, literature search was conducted based on which relevant and quality published articles were selected and used to discuss the topic. The result signifies that the spatially explicit GIS-based techniques can be used to create georeferenced estimates of AGB, and carbon sink/stock potential. Also, data from different sources has their unique advantages and drawbacks, which can affect the accuracy of AGB and carbon stocks assessment. However, integrating these data has proven to be highly efficient. Summarily, GIS provides the essential platform for acquiring, integrating, analyzing, and visualizing diverse data sources. This enables the creation of spatially continuous and accurate map of AGB and carbon stocks across landscapes, regions and continents.

Keywords: Above-Ground Biomass, Activity Data, Carbon Sequestration, forests, GIS, REDD+

  1. Introduction

The tropical forests are generally characterized by high biomass and carbon content, which makes them to have huge influence on the global carbon cycle. They have unlimited potential for mitigating carbon dioxide (CO2) emission through suitable conservation and management. On the other hand, deforestation alone is responsible for approximately 12% of the global human-induced emissions of greenhouse gas (GHG) and peat oxidation while fires on degraded peat lands causes another 6% [1]. Also, 10–25% of global emissions resulting from anthropological activities are linked to combined impact of logging and forest re-growth on abandoned land [2,3]. The significance of deforestation in global carbon cycle is apparent. This gave rise to the Bali Action Plan agreed on enhancement of national/international action on climate change mitigation. This includes inter alia, consideration of policy approaches and payment with regards to reducing forest-related emissions in developing nations [4].

The forest biome is a massive carbon pool that can diminish emissions of net GHG through reduction of sources that enhance sinks of CO2 [5, 6]. Precise spatial and temporal evidence of the existing condition of carbon sources and sinks is required for policy formulation to mitigate greenhouse effects [7]. Monitoring biomass and carbon stocks accurately can now be achieved, thanks to increasingly available of fine resolution and large spatial geographically referenced data. Also, the data can be used to make models that establish the relationship between biomass and their drivers can be used to estimate biomass and carbon at global level. So far, there are many GIS-based spatially explicit approaches for spatiotemporal estimation of carbon sink and stock [8,9]. GIS is a typical processing and visualization tool [9,10]. Nevertheless, much of the existing studies on estimation of terrestrial carbon sequestration and land-use spatial planning have not integrate process-based models with GIS [11].

Mapping and quantifying the tropical AGB is essential in the estimation of carbon dynamics resulting from the modification in LCLU [12]. Though site-specific estimates of AGB based on various modelling is common practice, pan-tropical or global estimates are developed through the combination of ground inventories and remotely sensed forest data. For instance, Saatchi et al. [13] mapped the pan-tropical live biomass at 1-km spatial resolution in 2011. They used a wide-ranging inventory data from 4,079 plots and many remote sensing techniques (optical, microwave and LiDAR sensors). It was revealed that the total of 247 PgC woody biomass was stored in the tropical vegetation. In this, AGB contributed 78% of carbon stocks while 22% of carbon stocks was from below ground biomass. An improved map of the pan-tropical AGB at 500m resolution emerged in 2012 as a result of additional work. The integrated data to create this map were from field inventories, 70 meters resolution LiDAR, and 500 meters resolution MODIS images [12]. Similar to this, Kanja, Zhang, and Atkinson [14] evaluated the capacity to map the AGB of Zambia’s Miombo woodlands using data from Landsat-8 OLI, Sentinel-1A, and extensive national forest inventory.

  • Methodology

This review discussed Geographic Information System and multi-source data integration for enhancing the accuracy of above-ground biomass and carbon stocks estimation. Relevant materials used consisted of research articles availed from reputable electronic databases including Web of Science and Scopus. Apart from research articles, grey literatures were equally cited in this paper. The main search for information on the review topic was conducted from September 2025 to November 2025.
  • Results and Discussion
    • Role of Geographic Information System for AGB and Carbon Stocks Estimation

A Geographic Information System is a computer-based tool for storing, retrieving, modifying, analysing, and displaying georeferenced data. It is an automated mapping and analysis system, which depends on data that are related to the geographic location of physical entities, and activities. Its intention is to locate and describe places on the Earth’s surface.

GIS data can be used for spatiotemporal monitoring of Land use and Land cover (LULC). LULC and LULC change are used as Activity Data (AD) in carbon stocks assessment. LULC is responsible for approximately 10 percent of global greenhouse gas [15]. According to Yadav [16], the boundaries of LULC classes from satellite-based analysis are typically transferred to a map to create mapping units. These units can then be digitally transformed into a GIS environment to create a vector polygon map. It is noteworthy that GIS is a spatial platform for creating data layers and databases. Apart from accurate and effective management of features [17] such as forests, GIS can be used to easily create spatial models for simulating various situations.

Additionally, georeferenced estimates of carbon sink and stock potential can be produced using spatially explicit GIS-based methods. The GIS is typically used for processing model inputs (e.g., soil texture, land cover) and visualizing the outcomes. For instance, Fatoyinbo and Simard [18] used GIS to combine height data from the Shuttle Radar Topography Mission (SRTM) and spatial coverage of the mangrove generated from Landsat imagery with the intention of computing Africa biomass of mangroves. Furthermore, Malysheva et al. [19] studied the GIS-based assessment of carbon dynamics for Russian forests. In another study, Kehbila et al. [20] carried out a comparative multi-criteria evaluation of Cameroonia’s sustainable development plans and climate policies to create a GIS decision-support tool for the creation of the best possible REDD+ plan.

It is good to note that carbon sequestration provides a major economic value of the ecosystem. Thus, it has become an essential tool for application by United Nations Framework Convention on Climate Change (UNFCCC) in REDD+ programme. Generally, the financial estimation of forest environment services is significant because it assigns an amount on nature. This estimation can correspondingly serve the purpose of guiding climate change policy-makers and decision-makers [21]. The core of REDD+ initiative is the delivery of financial reward to developing nations for keeping carbon stored in their natural forests. The economic worth of carbon sink and stock of forest environment can be mapped and quantified in a GIS environment. In this case, GIS is used for developing database, executing spatial analysis and mapping economic worth. The appraisal process used to determine and monetize the amount of carbon stock and carbon sequestered was measured and validated by Pache et al. [22]. This was accomplished through combination of terrestrial scanning, and monetary valuation to display the sequestered carbon’s spatiotemporal market value

The ground-based field measurements are the most accurate methods for biomass assessment. It is used to obtain precise data on tree for creating allometric models for computing AGB [23]. But field measurements are possible only on a limited number of points at the sample plot scale. Also, their sampling density are insufficient to afford the requisite spatial variability; and it is usually hard to sample large areas [24]. The ground-based field measurements are also costly, time consuming, and labour intensive [25]. Remote Sensing technology is thus adopted for collecting data or for large-scale mapping and monitoring of various entities such as forest AGB, vegetation structure, vegetation productivity and others [26]. However, remote sensing application has its own associated issues.

By and large, three of the key data sources that are currently being employed for forest AGB mapping and assessment include ground surveys, satellite imagery, and LiDAR. Of course, each data source has its advantages and disadvantages [27]. Thus, the combination many data from various sources can help in analyses of variables that cover a large extent. Integrating multisource data including satellite imagery into a GIS is a potential method for producing spatially-explicit estimates of AGB across a large extent. The majority of current forest estimating research has shown higher accuracy and capacity over a wide area by merging multisource remote sensing data [28]. For example, Forkuor et al. [29] mapped the forest Above-ground biomass by combining Sentinel-1 (S1) and Sentinel-2 (S2) with derivative data. Ma et al. [30] used PALSAR-2 and topographic data to predict AGB in China. Tariq, Shu, Li, et al. [31] effectively analyzed prescribed forest burning and showed Using S1 data.

Many types of satellite data can be used to estimate forest biomass [32] with each type characterized by its advantages and disadvantages. For example, optical sensors were primarily used for forest remote sensing [33]. Although optical data are commonly employed in AGB estimation, their general use is constrained by data saturation issues in places with high vegetation biomass or canopy density, and regular cloud cover. The data from Radar may flow through forest canopies and clouds, unlike passive optical systems [34], however it is impacted by signal saturation [35]. Furthermore, LiDAR data can record a forest’s vertical structure in great detail, hence, it is an excellent substitute for optical and radar data. The 3D data provided by LiDAR is closely linked to forest biomass [36].

  • Conclusion and Future Scope

In this paper, we reviewed the application of Geographic Information System, and the significance of data integration in appraising above-ground biomass and carbon stocks. It has been demonstrated in this study that spatially explicit GIS techniques can be used to create georeferenced estimates of AGB, and carbon sink/stock prospects. With GIS, it is easy to process model inputs and also visualize the results. A GIS decision-support tool for creating the best possible REDD+ plan is available through the GIS-based evaluation. Also, many data sources available for mapping and estimation of AGB and carbon stocks has their unique pros and cons. Therefore, integrating them will normally produce highly accurate result.

Finally, there is likelihood that spatially precise outlines of the worth regarding forest carbon sink and stock may soon require at various scales. Thus, be mapped using GIS techniques can be used to map the forest ecosystem and its values. Of course, this will provide managers with a foundation for identifying which areas need additional focus.

References

  • G.R. Van der Werf, D.C. Morton, R.S. Defries, J.G.J. Olivier, P.S. Kasibhatla, R.B. Jackson, G.J. Collatz, & J.T. Randerson, “CO2 Emissions from Forest Loss. Nat Geosci., Vol.2, pp.737-738, 2009.
  • F. Achard, H.D. Eva, H. Stibig, P. Mayaux, J. Gallego, T. Richards, & J. Malingreau, “Determination of Deforestation Rates of the World’s Humid Tropical Forests,” Science, 297, 999-1002, 2002.
  • R.E. Gullison, P.C. Frumhoff, J.G. Canadell, C.B. Field, D.C. Nepstad, K. Hayhoe, R. Avissar, LM. P. Friedlingstein, C.D. Jones, et al., “Tropical Forests and Climate Policy,” Science, Vol.316, pp.985-986, 2007.
  • United Nations Framework Convention on Climate Change (UNFCCC). “Report of the Conference of the Parties on its thirteenth session, held in Bali from 3 to 15 December 2007. Addendum Part Two: Action taken by the Conference of the Parties 2007 at its thirteenth session,” FCCC/CP/2007/6/Add1, 2008.

http://unfccc.int/resource/docs/2007/cop13/eng/06a01.pdf.

  • B.H.J. De Jong, R. Tipper, & G. Montoya-Go´mez, “An Economic Analysis of the Potential for Carbon Sequestration by Forests: Evidence from Southern Mexico,” Ecological Economics, Vol.33, pp.313–327, 2000.
  • K.R. Richards, & C. Stokes, “A Review of Forest Carbon Sequestration Cost Studies: A Dozen Years of Research,” Climatic Change, Vol.63, pp.1–48, 2004.
  • G.X. Wang, T. Oyana, M.Z. Zhang, S. Adu-Prah, S.Q. Zeng, H. Lin, et al., “Mapping and Spatial Uncertainty Analysis of Forest Vegetation Carbon by Combining National Forest Inventory Data and Satellite Images,” Forest Ecology and Management, Vol.258, pp.1275-1283, 2009.
  • J.M. Chen, W.M. Ju, J. Cihlar, D. Price, J. Liu, W.J. Chen, et al., “Spatial distribution of carbon sources and sinks in Canada’s forests,” Tellus, Vol.55B, pp.622–641, 2007.
  • R. Ponce-Hernandez, “Assessing carbon stocks and modelling win-win scenarios of carbon sequestration through land-use changes,” FAO, Rome, Italy, 2004.
  • J. Ardö, L. Olsson, “Assessment of Soil Organic Carbon in Semi-arid Sudan using GIS and the Century Model,” Journal of Arid Environments, Vol.54, pp.633–651, 2004.
  • J. Wang, J. M. Chen, W. M. Ju, M. C. Li, “IA-SDSS: A GIS-based Land Use Decision Support System with Consideration of Carbon Sequestration,” Environmental Modelling & Software, Vol.25, pp.539-553, 2010.
  • A. Baccini, S. J. Goetz, W. S. Walker, N. T. Laporte, M. Sun, D. Sulla-Menashe, J. Hackler, P. S. A. Beck, R. Dubayah, M. A. Friedl, et al., “Estimated Carbon Dioxide Emissions from Tropical Deforestation Improved by Carbon-density Maps,” Nat. Clim. Chang. Vol.2, pp.182–185, 2012. [CrossRef.
  • S.S. Saatchi, N.L. Harris, S. Brown, M. Lefsky, E.T.A. Mitchard, W. Salas, B.R. Zutta, W. Buermann, S.L. Lewis, S. Hagen, et al., “Benchmark Map of Forest Carbon Stocks in Tropical Regions Across Three Continents,” Proc. Natl. Acad. Sci. Vol.108, pp.9899–9904, 2011. [CrossRef] [PubMed].
  • K. Kanja, C. Zhang, P.M. Atkinson, “Evaluating Multi-Seasonal SAR and Optical Imagery for Above-Ground Biomass Estimation using the National Forest Inventory of Zambia,” International Journal of Applied Earth Observation and Geoinformation, Vol.139, p.104494, 2025.
  • G. Grassi, J. House, F. Dentener, S. Federici, M. den Elzen, J. Penman, “The Key Role of Forests in Meeting Climate Targets Requires Science for Credible Mitigation,” Nat. Clim. Chang., Vol.7 Issue 3, 220–226, pp.2017. https://doi.org/10.1038/nclimate3227.
  • S.K. Yadav, “Spatial Technology-Based Assessment of Biomass and Carbon Stock,” Int. J. Environmental Sci.: Dev. Moni., Vol.4, Issue 3, pp.73-76, 2013.
  • S. Mukherjee1, S.S. Rizvi, G. Biswas, A.K. Paswan, S.P. Vaiphei, T. Warsi, Tarik Mitran, “Aquatic Ecosystems under Influence of Climate Change and Anthropogenic Activities: Potential Threats and its Mitigation Strategies,” In Hydrochemistry of Aquatic Ecosystems, 1st edition (Eds.), S. Madhave, V.B. Singh, M. Kumar, S. Singh. John Wiley and Sons Limited 307–331, 2022.
  • T.E. Fatoyinbo, & A.M. Simard, “Height and Biomass of Mangroves in Africa from ICESat/GLAS and SRTM,” Int. J. Remote Sens., 34, pp.668–681, 2013.
  • N. Malysheva, T. Zolina, A. Tsyplenkov, & A. Filipchuk, “GIS Support of Carbon Sequestration, Emissions and Balance Assessment for Russian forests,” In: T. Bandrova, Konečný M., Marinova S. (Eds.), 8th Proceedings International Conference on Cartography and GIS, Vol.1,2020.
  • A.G. Kehbila, D. Alemagi, & P.A. Minang, “Comparative Multi–Criteria Assessment of Climate Policies and Sustainable Development Strategies in Cameroon: Towards a GIS decision–support tool for the design of an optimal REDD+ strategy,” Sustain., Vol.6, pp.6125–6140, 2014. doi:10.3390/su6096125
  • G. Valatin, “Carbon Valuation in Forestry and Prospects for European Harmonization–European Forest Institute Technical Report,” Vol.97. 2014. Available online: https://efi.int/sites/default/files/files/publication-bank/2018/tr_97.pdf.
  • R.-G. Pache, I.V. Abrudan, M.-D. Nit, “Economic Valuation of Carbon Storage and Sequestration in Retezat National Park, Romania,” Forests, Vol.12, p.43, 2021. https://doi. org/10.3390/f12010043
  • D.C. Chojnacky, L.S. Heath, J.C. Jenkins, “Updated Generalized Biomass Equations for North American Tree Species,” Forestry. Vol.87, Issue 1, pp.129–151, 2014.
  • S. Tadese, T. Soromessa, T. Bekele, A. Bereta, F. Temesgen, “Above Ground Biomass Estimation Methods and Challenges: A Review,” Measurement Vol.9, pp.12–25, 2019. https://doi.org/10.7176/JETP/9-8-02.
  • S. Attarchi, R. Gloaguen, “Improving of Above Ground Biomass using Dual Polarimetric PALSAR and ETM+ Data in the Hyrcanian fore tainnuomts (Iran),” Remote Sens., Vol.6, pp.3693–3715, 2014.   
  • C.S.R. Neigh, D.K. Bolton, M. Diabate, J.J. Williams, N. Carvalhais, “An Automated Approach to Map the History of Forest Disturbance from Insect Mortality and Harvest with Landsat Time-Series Data. Remote Sens., Vol.6, pp.2782–2808, 2014.   
  • S. Abbas, M.S. Wong, J. Wu, N. Shahzad, S. Muhammad Irteza, “Approaches of Satellite Remote Sensing for the Assessment of Above-Ground Biomass Across Tropical Forests: Pan-Tropical to National Scales. Remote Sens., Vol.12, pp.3351, 2020. https://doi.org/ 10.3390/rs12203351.).
  • D. Lu, Q. Chen, G. Wang, L. Liu, G. Li, E. Moran, “A Survey of Remote Sensing-Based Aboveground Biomass Estimation Methods in Forest Ecosystems,” Int J Digital Earth. Vol.9, Issue 1, pp.63–105, 2016.
  • G. Forkuor, J.-B. Benewinde Zoungrana, K. Dimobe, B. Ouattara, K. P. Vadrevu, J.E. Tondoh “Above- Ground Biomass Mapping in West African Dryland Forest using Sentinel-1 and 2 datasets – A Case Study,” Remote Sens Environ., Vol.236, p.111496, 2020.
  • J. Ma, X. Xiao, Y. Qin, B. Chen, Y. Hu, X. Li, B. Zhao, “Estimating Aboveground Biomass of Broadleaf, Needleleaf, and Mixed Forests in Northeastern China through Analysis of 25-m ALOS/PALSAR Mosaic Data,” Forest Ecol Manage., Vol.389, pp.199–210, 2017.
  • A. Tariq, H. Shu, Q. Li, O. Altan, M.R. Khan, M.F. Baqa, L. Lu, “Quantitative Analysis of Forest Fires in Southeastern Australia using SAR Data,” Remote Sens., Vol.13, Issue 12, p.2386, 2021.
  • Y. Lin, & West, G. “Reflecting Conifer Phenology using Mobile terrestrial LiDAR: A Case Study of Pinus Sylvestris Growing under the Mediterranean Climate in Perth, Australia,” Ecol. Indic., Vol.70, pp.1–9, 2016.
  • R. Pu, & J. Cheng, “Mapping Forest leaf area index using Reflectance and Textural Information Derived from Worldview-2 Imagery in a Mixed Natural Forest Area in Florida, US,” Int. J. Appl. Earth Obs. Geoinf., Vol.42, pp.11–23, 2015.
  • E. Santi, S. Paloscia, S. Pettinato, G. Fontanelli, M. Mura, C. Zolli, …, G. Chirici, “The Potential of Multifrequency SAR Images for Estimating Forest Biomass in Mediterranean Areas,” Remote Sens. Environ., Vol.200, pp.63–73, 2017.
  • T. Zhou, Z. Li, & J. Pan, “Multi-Feature Classification of Multi-Sensor Satellite Imagery based on Dual-Polarimetric Sentinel-1a, Landsat-8 OLI, and Hyperion Images for Urban Land-Cover Classification,” Sensors, Vol.18, pp.373, 2018.
  • G. Laurin, V., Chen, Q., Lindsell, J. A., Coomes, D.A., Del Frate, F., Guerriero, L., …, R. Valentini, “Above Ground Biomass Estimation in an African Tropical Forest with LiDAR and Hyperspectral Data,” ISPRS-J. Photogramm. Remote Sens., Vol.89, pp.49–58, 2014.

 Spatiotemporal Mapping and Analysis of the Land Use and Land Cover in Makurdi, Nigeria 

 Ibrahim, A. D., & Umoru, K. (2026). Spatiotemporal Mapping and Analysis of the Land Use and Land Cover in Makurdi, Nigeria. International Journal of Research, 13(1), 278–286. https://doi.org/10.26643/ijr/2026/6

Daily writing prompt
Name an attraction or town close to home that you still haven’t got around to visiting.

Abakpa David Ibrahim1, Kebiru Umoru2*

1University Library, University of Abuja, Nigeria

2National Centre for Remote Sensing, Jos, Nigeria

Correspondence: t.omali@yahoo.com

Abstract 

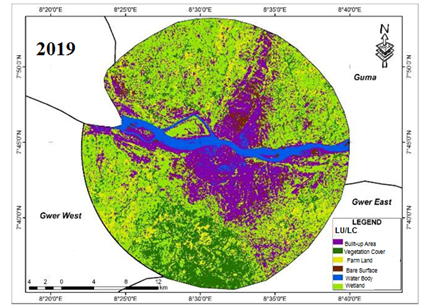
This study employed geospatial techniques to capture the process of land conversion taking place. The objectives include mapping the land use types. The methodology involved geospatial technique which uses remote sensing and GIS techniques to identify the past and current condition of land use change occasioned development activities in the Makurdi Metropolis for the period of 1999, 2009 and 2019. The result shows that overall, there was progressive and increasing change in built-up area and water body categories, at (17.00%) and (1.73%) respectively during the period of study. However, vegetation cover, farm land, bare land and wetland decreased by (2.51%), (3.51%), (4.61%) and (8.08%) respectively. Residential buildings are fast encroaching the flood plain of River Benue in Makurdi. There is a need to sensitize the residents on the danger of flooding and provisions should be made to relocate those already occupying the location.

Keywords: GIS, land use change, Imagery, Mapping, remote sensing

  1. Introduction

The population of the world is growing at different rates relative to the total population (Omali, 2020), and it is becoming more urbanized (Enoch, John, and Jonathan, 2020). Changes in land use and land cover (LULC), which are more common in developing countries, are a result of this population growth. Due to the “push” of rural areas and the “pull” of urban centers, Nigeria’s high rate of urbanization is changing its land use (Aluko, 2013). Unprecedented alterations in the ecosystem and environmental processes have, of course, been brought about by natural forces and human activity (Okeke and Omali, 2016). This has resulted in a decline in biodiversity and environmental degradation. Land use and cover change is a global phenomenon. While urban centers are growing in population and area the surrounding open/agricultural lands are rapidly changing. Construction is putting increasing pressure on the land use to make room for a variety of urban land uses. There are severe consequences from the ruthless reduction of available land per person, including low or decreased food production, ecological degradation, environmental problems, and socioeconomic difficulties.

Current methods for managing natural resources and keeping an eye on environmental changes heavily rely on studies on changes in land use and land cover (LULC) (Okeke and Omali, 2016). This makes it feasible to comprehend human interactions with natural resources, both past and present, as well as their effects. To get the desired outcome, the conventional approach to LULC assessment is inadequate (Okeke and Omali, 2018). Therefore, it’s critical to use cutting-edge technologies, such as sophisticated computers, remote sensing, geographic information systems (GIS), GPS, and the power of spatial information systems (Okeke and Omali, 2016). Since remote sensing is the only affordable technology that provides data on a global scale, it provides an important means of detecting and analyzing spatiotemporal dynamics on geographical entities (Omali, 2018a). Through the use of aerial or spaceborne sensors, remote sensing gathers data about Earth without requiring the sensors to come into direct physical contact with the target or object of interest (Omali, 2022a). According to Omali (2021) the electromagnetic radiation serves as the transmission medium for information. GIS is typically employed in the gathering, storing, modifying, analyzing, visualizing, and presenting of georeferenced data and information (Omali, 2022b). Through the manipulation, analysis, statistical application, and modeling of spatial data, it provides us with the ability to handle spatially referenced data (Omali, 2022c). In general, remote sensing data and GIS techniques have emerged as incredibly helpful tools for mapping natural resources, such as vegetation and changes in land use/cover over geographic areas. This has allowed for the removal of many of the constraints associated with traditional surveying techniques and the acquisition of a continuous and comprehensive ecosystem inventory. In light of this, research on the LULC in Makurdi was conducted using geospatial technologies over a 20-year period, from 2009 to 2019.

  • Methodology
    • Data

Both primary and secondary sources provided data for the study; some of these are listed in Tables 1a and 1b. Satellite imagery and field observations make up the main sources. During the field campaign, training site coordinates were recorded using a handheld GPS device (Garmin Etrex 32). With the GPS using satellite, almost anywhere on Earth can be located at any time (Omali, 2023a). Furthermore, it is important to note that time-series data, such as remotely sensed data from various eras, must be applied in order to study and monitor LULC (Omali, 2023b). As a result, the time-series satellite data from three epochs of multi-spectral Landsat TM/ETM/OLI imagery were used in this study. Other materials such as newspapers, journals, textbooks, World Bank publications, and maps are included in the secondary sources.   

Table 1a: Maps used in the study

 TypeDate of ProductionSourceScale
Landuse/landcover mapSecondary1999Military Air Force Base Makurd1:1000000
A base map of Makurdi LGASecondary2019Benue State Ministry of Land and Survey1:50000

      Table 1b: Satellite imageries used in the study

 TypePath/RowDate of ImagerySourceResolution
 TM (Band 1-7)Primary188/55July 5, 1999Global Land Cover Facility (GLCF) database.30m
 ETM+(Band 1-7)Primary188/55August 4, 2009Global Land Cover Facility (GLCF) database.30m
OLI+Primary188/55July11, 2019Global Land Cover Facility (GLCF) database.30m
  • Pre-processing of the Satellite Imagery

It is crucial to pre-process satellite images for accurate change detection (Andualem et al., 2018). Time series analysis requires this crucial step in order to reduce noise and improve the interpretability of image data (Yichun et al., 2008). The processes and methods used in satellite image processing include geometric correction, atmospheric and radiometric correction, and masking study areas. To produce a consistent and trustworthy image database, radiometric and atmospheric correction is applied to account for variations in the viewing geometry and instrument response characteristics, as well as atmospheric conditions related to scene illumination. Pre-processing techniques used in this study included study area masking, image enhancement, and correction for atmospheric and radiometric errors. In order to bring the image scene and the scanned topographic maps into the same coordinate system, they were also co-registered into UTM zone 32N, WGS 84.

  • Image Classification

The goal of the imagery classification process was to assign each pixel in the digital image to one of many land cover classes, or “themes” (Omali, 2018b). This allows for the creation of thematic maps of the land cover present in an image. Finding the land use and land cover class of interest was the first stage in this study’s mapping and change analysis of land use and land cover. In this investigation, we employed six classes, as indicated in table 2, by incorporating and adapting the classification scheme from Andersen et al. (1971). The classes listed in Table 2 were utilized in this study. Also, the maximum likelihood supervised classification technique was used to classify LULC images from Landsat data. The study’s training sites were first located and defined. Fieldwork yielded training samples in line with Lu and Weng (2007). For the actual supervised classification of the study area, signature files containing statistical data about the reflectance values of the pixels within the training site for each of the LULC types or classes were developed in line Ojigi (2006). The supervised classification algorithm was imputed with the signatures.

        Table 2: Land Use/Land Cover Classification Scheme

Land UseDescription
Built-up Areacomprises all developed surfaces including residential, commercial, industrial complexes, public and private institutions, recreational areas, Airport, Factories, Interstate highways, roads networks that linked most of the areas together.
Vegetation,areas covered with plants of various species. This category includes grassland and non-agricultural trees and shrubs they are mostly wild plants.
Farm Land,land used primarily for cultivation of food and fibre, it includes cropped areas, fallow land and plantations (Ochards, nursery, vineyard etc.), harvested areas and herbaceous croplands.
Bare Surface,includes open surfaces, rocky outcrops, sandy area, strip mines, quarries, gravel pits, silt etc. Exposed soil devoid of vegetal cover, that is, open spaces.
Water body,includes areas covered with water bodies such as rivers, streams, lakes, flood plain, Reservoirs. It also includes artificial impoundment of water like dam used for irrigation, flood control, municipal water supplies, recreation, etc.
Wetland.an area where water covers the soil either at or near the surface of the soil all year or for varying periods of time during the year, including during the growing season.  

       Source: Adapted and modified from Anderson et al., (1971)

  • Land Use and Land Cover change Detection

There are numerous approaches for detecting changes in multi-spectral image data, such as time series analysis, vector analysis of spectral changes, and characteristic analysis of spectral type. Time series analysis is the most common method, and it was used in this study. Its objective is to analyze the course and trend of changes by tracking ground objects using continuous observation data from remote sensing (Adzandeh, et al., 2014). Naturally, post-classification comparisons can yield results of change that are acceptable and provide “from-to” data (Okeke and Omali, 2018).

  • Results and Discussion
    • Land Use and Land Cover Classification Result

The satellite imageries covering the study area were classified in GIS environment. Tables 2 reveal that there is a progressive and significant increase in built-up area which is necessitated by the increase in commercial activities, residential growth, economic and social activities. This is in line with the findings of Etim and Dukiya (2013) who opine that urban encroachment on agricultural land has reduced the productivity of most farmers in Makurdi. The water body recorded little increase due to the increase in water works like construction of Kaptai Lake, which is the largest artificial lake in the country. The farm land, vegetation, bare land and wetland decreases throughout the period of study.

           Table 3: Land use and land cover distribution of Makurdi

  Class1999           20092019
Area (km2)(%)Area (km2)(%)Area (km2)(%)
Built-up98.07911.97170.96820.86237.4628.97
Vegetation138.2016.86125.69515.33117.65314.35
Farm Land203.5624.83184.60822.52174.73521.32
Bare Land142.48717.38122.24914.91104.56112.77
Water Body22.45902.7429.16403.5636.65804.47
Wetland214.8926.22186.9922.78148.69618.14
Total819.670100819.670100819.670100

The classified images (false colour composite) for the different periods 1999, 2009 and 2019 of study area are shown in Figures 5.1, 5.2 and 5.3 respectively. These colour composite shows the visual distribution pattern of the distribution and change taking place in the images of the areas throughout the period of study. The dominating land use and land cover category in 1999 as shown in Table 3 and figure 1 is the wetland covering an area of 214.89km2 (26.22%). This is understandable as Hemba, et al. (2017) describes the relief of Makurdi town as lying entirely in the low- laying flood Plain with River Benue forming the major drainage channel. Farm land covers 203.56km2 representing 24.83% of Makurdi.

                                        Figure 1: Land Use and Land Cover of Makurdi in 1999

 Most residents engage in farming, either crop production or livestock farming as the soil is fertile and the weather is conducive for agricultural practices. This assertion supports the views of Hula, (2010) who noted that most farmers in Makurdi cultivate land for crop production, rearing of animals for consumption and selling part of the produce to generate money to meet other needs. The populace of Makurdi comprises of indigenous farmers and migrants who are mostly engaged in farm activities as noted by Oju et al. (2011). Due to farming and hunting and other activities like sand mining carried out  in Makurdi, the size of bare land is observed to occupy large space of about 142.487km2 represented by 17.38% in 1999. This is because farmers have enough space to cultivate. Farmers relocate to other lands whenever a particular land becomes unproductive and this has been the major cause of bare land in the study area. These contradicts Tee (2019) who argued that hunting, grazing  and other factors, which lead to clearing of land through manual, mechanical and chemical means have greatly changed the original vegetation cover to bare land and other classes of land use in Makurdi. The vegetation covered a reasonable size of land and it was 138.20km2 (16.86%).This is attributed to the few number of settlers in Maukurdi and low level of human activities taking place within the urban centre as at the time. The water body was 22.459 km2 (2.74%) with River Benue forming the major drainage system in the area and is the main source of water for human use. This is in line with the views of Nnule and Ujoh, (2017) who pointed out that Benue River is the main source of water in Makurdi. This doesn’t mean that other form of water sources like borehole, ponds and dams are not important.

Table 1 and figure 2 shows that the wetland had the largest area coverage of about 186.99km2 (22.78%) in 2009 as the entire land fall within the Benue Valley and Trough. The geology of the study area influence the wetland, this infect is also confirmed by Iorliam, (2014). The farmland occupies 184.608km2 (22.52%), as most residents are farmers. The number is significant as civil

                              Figure 2: Land Use and Land Cover of Makurdi in 2009.

servants also own farms. The built-up, which was 170.968km2 (20.86%) recorded a high increase due the increase in population. This corroborates the findings of Jiang, et al. (2013) which stated that the urban expansion on agricultural land is associated with both shrinking agricultural land area and a higher level of urban development. It also agrees with the findings of Araya and Cabral (2010) that substantial growth of urban areas has occurred worldwide in the last few decades with population increase being one of the most obvious agents responsible. The vegetation cover depreciated to 125.695km2 (15.33%). This may be attributed to deforestation as more forest was cleared to provide more space for increasing human development. This is buttressed by Mugish and Nyandwi (2015) that housing development on arable farm land in most cities has become an issue on the global agenda in recent times. Bare land, which was 122.52km2 (14.91%) decreased as the spaces were being covered with more structures but the water body 29.164km2 (3.56%) slightly increased. Of course, this is an indication that most of the human activities use water and other sources of water are being developed to meet the need of the increasing populace.

The level of human activities in the year 2019 was very high, although Makurdi has no functional Master Plan to check the developmental activities, however, as shown in the image Fig5.3 and Table5.1, The built-up area of 237.46km2 (28.97%) in 2019 almost tripled its size recorded in 1999.This supports the assertion by United Nations Department of Economy and Social Affairs (UNDESA, 2010) that urban cities have changed from small isolated population

                                 Figure 3: Land Use and Land Cover of Makurdi in 2019.

centres to large interconnected economic, physical, and environmental features. In recent time, issues of Herdsmen/Farmers crisis are among factors contributing to the migration of people from neighbouring villages to Makurdi Town for safety. These numbers of people who mostly settled along the urban hinterland, which is mostly used for agricultural purpose, have converted the land for building of houses and other socioeconomic infrastructures. The farm land occupies 174.735km2 (21.32%) as it decreases with population upsurge settles in the study area. Farmers move outside of Makurdi to get land for their activities which make the cost of cultivation expensive than expected. Agencies with the mandate of protecting natural ecosystem are weak in areas of law enforcement in Makurdi as infrastructural developments are indiscriminately carried out. This observation contradicts the views of Wade quoted in Nico et al. (2000) that Various NGOs, government and international Agencies have been supporting the urban agriculture (UA) since 1970s in major world regions. There was reduction in wetland to 148.696km2 (18.14%) and vegetation cover to 117.653km2 (14.35%) compared to the previous ten years while the water body 36.658km2(4.47%) increases during the same periods.

  • Conclusion

The research findings revealed that built-up area increased all through the period of study while arable land decreases due to infrastructural development. The rapid increase in built-up area is because the surrounding agricultural land is fast decreasing. Bare land, vegetation and wetland decreased throughout the period of study as human settlement increases over the years. Of course, it was observed that the effect of the development was concentrated more to the north eastern part of Makurdi as residential buildings with high rate of economic activities is observed in the region. Generally, this study has been able to show that conversion of open/agricultural land for infrastructural development was mostly due to increase in number of people through migration and natural means of population growth. The land use and land cover change detection for the period of 20 years revealed the extent and type of conversion. The study recommends Green areas within and around the city should be properly preserved as this allows for ventilation. All effort should be put in place to prevent unofficial development and measures should be in place to curb population growth which has encouraged urban sprawl on prime agricultural land as this is feasible around Makurdi hinterland.

References

Aluko, O. (2011). Sustainable Housing Development and Functionality of Planning Laws in Nigeria: The case of Cosmopolitan Lagos. Journal of Sustainable Development, 4(5), 139–150.

Anderson, J. R. (1971). Land use classification schemes used in selected recent geographic applications of remote sensing: Photogramm. Eng., v. 37, no. 4, p. 379–387.

Adzandeh, E. A.; O. O. Fabiyi and Y. A. Bello. (2014). Statistical Analysis of Urban Growth in Kano Metropolis, Nigeria. International Journal of Environmental Monitoring and Analysis.2 (1): 50–56

Araya, Y. H. and Cabral, P. (2010). Analysis and Modeling of Urban Land Cover Change in Setúbal and Sesimbra, Portugal. Remote Sensing, 2: 1549–1563

Enoch, T. I.; T. S. John and I. A. Jonathan. (2020). Spatial Expansion of Urban Activities and Agricultural Land Encroachment in Makudi Metropolis: European Journal of Environment and Earth Science, 2684–446X

Etim, N. E. and J. J. Dukiya. (2013). GIS Analysis of Peri–Urban Agricultural Land Encroachment in (FCT), Nigeria. International Journal of Advanced Remote Sensing and GIS, 2(1): 303–315.

Hemba, S.; T. Enoch. l. Orimoleye and P. Dam. (2017). Analysis of the Physical Growth and Expansion of Makurdi Town. Imperial Journal of Interdisciplinary Research.3(4).

Hula, M. A. (2010). Population Dynamics and Vegetation Change in Benue State, Nigeria. Journal of Environmental Issues and Agriculture in Developing Countries, 2(1), pp53.

Iorliam, T. S. (2014). The Dialectics between Physical Plans and Physical Development in Contemporary Urban Nigeria: Empirical Evidence from the Kighir-Adeke Layout, Makurdi, Nigeria. Academic Research International Vol. 5(4).

Jiang, L; X. Deng and K. Seto. (2013). The Impact of Urban Expansion on Agricultural Land Use intensity in China. Land Use Policy, 35: 33–39.

Lu, D. and Q. Weng, (2007). A Survey of Image Classification Methods and Techniques for Improving Classification Performance. International Journal of Remote Sensing, vol. 28, pp. 823–870.

Mugish, J. and E. Nyandwi. (2015). Kigali City Peri-Urbanization and its Implications on Peri-Urban Land Use Dynamics: Cases of Muyumbu and Nyakaliro. GeoTechRwanda 2015– Kigali

Ojigi, L. M. (2006). Analysis of Spatial Variations of Abuja Land Use and Land Cover From Image Classification Algorithms,’’ ISPRS Commission VII Mid–Term Symposium, 8 – 11th May 2006, Enschede, The Netherlands (Conference proceedings).

Okeke, F. I. and T. U. Omali. (2016). Spatio-temporal Evaluation of Forest Reserves in the Eastern Region of Kogi State using Geospatial Technology. Tropical Environment, 13(1): 75–88.

Okeke, F. I., and T. U. Omali. (2018). Monitoring Deforestation and Forest Degradation in Yankari Games Reserve of Bauchi, Nigeria. Presentation at NIS AGM/Conference Bauchi, 2018. 18th June–22nd June, 2018

Omali, T. U. (2018a). Prospects of satellite–Enhanced Forest Monitoring for Nigeria. International Journal of Scientific & Engineering Research, 9(5), 383–388.

Omali, T. U. (2018b). Impacts of Sensor Spatial Resolution on Remote Sensing Image Classification. Global Scientific Journal, 6(1), 63–68.

Omali, T. U. (2020). Ecological Evaluation of Urban Heat Island Impacts in Abuja Municipal Area of FCT Abuja, Nigeria. World Academics Journal of Engineering Sciences, 7(1): 66–72.

Omali, T. U. (2021). Utilization of Remote Sensing and GIS in Geology and Mining. International Journal of Scientific Research in Multidisciplinary Studies, 7(4): 17–24.

Omali, T. U. (2022a). Monitoring the Ecological Component of Sustainable Development Goals using Geospatial Information Tools: A Review. International Journal of Scientific Research in Biological Sciences, 9(1): 92–99.

Omali, T. U. (2022b). Correlation of Geographic Information System with the Evolutionary Theory of Spatial Analysis. International Journal of Scientific Research in Computer Science and Engineering, 10(4): 18–22.

Omali, T. U. (2023a). Time-series Analysis of Vegetation Cover in the Southwest Nigeria using Remote Sensing and GIS. International Journal of Scientific Research in Multidisciplinary Studies, 8(7): 36–42.

Omali, T. U. (2023b). Coordinate Transformation of GPS Measurement Results using the Cartesian-to-Ellipsoidal Transformation System. International Journal of Scientific Research in Mathematical and Statistical Sciences, 10(4): 09–13.

Tee, N. T., P. U., Ancha, and J. Asue. (2019). Evaluation of Fuel Wood Consumption and Implications on the Environment: Case Study of Makurdi area in Benue state, Nigeria. Journal of Applied Biosciences, 19:1041–1048.

Yichun X., S. Zongyao, and Y., Mei. (2008). Remote Sensing Imagery in Vegetation Mapping: A Review. J Plant Ecol., 1(1): 9–23.

Kricon Group Launches a New Generation of ISOPA-Certified Tank Containers for Isocyanate Logistics

Daily writing prompt
If you could make your pet understand one thing, what would it be?

The transportation of isocyanates such as MDI (Methylene Diphenyl Diisocyanate) and TDI (Toluene Diisocyanate) remains one of the most demanding areas in chemical logistics. Strict safety requirements, temperature sensitivity, and regulatory oversight leave no room for compromise. In response to these challenges, Kricon Group has introduced a new generation of tank containers engineered specifically to meet the highest standards of safety, reliability, and operational efficiency.

According to an article on Logistics IT, Kricon Group has developed these ISOPA-certified tank containers to ensure safe and compliant transport of MDI and TDI across Europe and international markets, reinforcing its role as a trusted partner in chemical logistics.

Addressing the Complexities of Isocyanate Transport

MDI and TDI are critical raw materials for a wide range of industrial applications, including polyurethane foams, coatings, adhesives, and elastomers. However, their chemical properties make transportation particularly complex. These substances require precise temperature control, secure handling procedures, and equipment that fully complies with industry-specific standards such as those set by ISOPA (European Diisocyanate & Polyol Producers Association).

Any deviation from recommended transport conditions can pose risks to personnel, the environment, and supply chain continuity. As a result, logistics providers and chemical manufacturers increasingly seek purpose-built equipment rather than adapted or generic tank containers.

Designed in Full Compliance with ISOPA Guidelines

Kricon Group’s newly introduced tank containers are designed and manufactured in strict alignment with ISOPA recommendations. Compliance is not treated as a formality but as a core design principle that influences every aspect of the container’s construction.

The containers incorporate standardized connection points to ensure seamless compatibility with ISOPA-approved loading and unloading systems. Enhanced insulation supports stable temperature conditions throughout transit, while integrated safety features help reduce the risk of contamination, leakage, or operational error. These design choices support traceability and accountability at every stage of the logistics process.

By aligning container specifications with ISOPA standards from the outset, Kricon enables chemical producers and logistics partners to operate with greater confidence and regulatory assurance.

Engineering Solutions Tailored to MDI and TDI

Unlike general-purpose chemical containers, Kricon’s latest units are specifically engineered to meet the unique demands of isocyanate transport. Materials used in the construction are selected for their resistance to corrosion and chemical interaction, helping to preserve product integrity over long distances and repeated use cycles.

Temperature control options play a central role in the container design. Maintaining stable conditions is essential for preventing crystallization or degradation of MDI and TDI. The new containers can be equipped with advanced insulation systems and temperature management solutions that support consistent performance in varying climatic conditions.

In addition, intelligent monitoring technologies allow operators to track key parameters during transit. This data-driven approach improves visibility, enables early detection of potential issues, and supports continuous improvement in logistics planning.

Safety as a Strategic Priority

Safety is not limited to regulatory compliance; it is also a strategic differentiator in chemical logistics. Kricon Group’s investment in high-specification tank containers reflects a broader commitment to protecting people, cargo, and infrastructure.

Enhanced valve systems, reinforced structural components, and optimized design for handling operations reduce the likelihood of incidents during loading, transport, and unloading. These features are particularly valuable for logistics partners operating across multiple jurisdictions with varying regulatory expectations.

By prioritizing safety at the equipment level, Kricon helps its clients mitigate risk, reduce insurance exposure, and strengthen trust with downstream partners.

Supporting Efficiency and Sustainability

Beyond safety and compliance, the new generation of tank containers is designed to improve operational efficiency. Standardized specifications simplify fleet management, while durable construction supports long service life and reduced maintenance requirements.

Efficient thermal performance and optimized design also contribute to sustainability goals. By minimizing product loss, reducing the need for reprocessing, and supporting more predictable transport conditions, these containers help lower the environmental footprint associated with chemical logistics.

Sustainability considerations are increasingly important for chemical manufacturers facing pressure from regulators, investors, and customers alike. Equipment that supports both safety and environmental responsibility offers a clear competitive advantage.

Backed by a Global Logistics Network

Kricon Group’s tank container solutions are supported by its established global logistics network. This enables seamless deployment across key industrial regions and ensures that clients can access consistent equipment standards regardless of route or destination.

For manufacturers and distributors of isocyanates, this combination of specialized equipment and international logistics expertise simplifies coordination and reduces complexity in cross-border operations. It also supports scalability as demand grows or supply chains evolve.

Setting New Benchmarks in Chemical Transport

The introduction of ISOPA-certified tank containers for MDI and TDI transport underscores Kricon Group’s role in shaping best practices within the chemical logistics sector. Rather than responding reactively to regulatory change, the company is proactively investing in solutions that anticipate future requirements.

As chemical supply chains become more complex and expectations around safety, transparency, and sustainability continue to rise, purpose-built logistics equipment will play an increasingly central role. Kricon’s latest tank containers represent a step forward in aligning operational performance with industry standards and long-term strategic goals.

Conclusion

Transporting MDI and TDI safely is a challenge that demands specialized expertise, advanced engineering, and strict adherence to industry guidelines. Kricon Group’s new ISOPA-certified tank containers address these demands through thoughtful design, robust safety features, and a clear focus on compliance and efficiency.

For companies involved in the production, distribution, or logistics of isocyanates, these containers offer a reliable solution that supports both operational excellence and regulatory confidence. As chemical logistics continues to evolve, innovations of this kind will be essential in setting new standards for the industry.

Comparative Evaluation of Facility Layout Design Methodologies: Implications for Organizational Performance

Daily writing prompt
What makes a good leader?

How to Cite it

Johnbull, E. U., Osuchukwu, N. C., & Omoniyi, A. E. (2026). Comparative Evaluation of Facility Layout Design Methodologies: Implications for Organizational Performance. International Journal of Research, 13(1), 213–218. https://doi.org/10.26643/ijr/2026/2

Egbukichi, Ugonna Johnbull1

Department of Industrial Safety and Bio-Environmental Engineering Technology. Federal College of land Resources Technology Owerri, Imo State

Omuma.jupoceada@gmail.com

Nkechi Cynthia Osuchukwu (Ph.D)2

Department of Political Science,

Chukwuemeka Odumegwu Ojukwu University, Igbariam,

Anambra State, Nigeria

cn.osuchukwu@coou.edu.ng

Awe Emmanuel Omoniyi3

Department of Economics

Nile university of Nigeria

Email – emmanuel.awe@nileuniversity.edu.ng

Abstract

This study examines eight facility layouts and designs methodologies, including Systematic Layout Planning, Activity Relationship Chart, Space Relationship Diagram, Graph Theory, Simulation Modeling, Lean Layout Design, Sustainable Design and computer aided design. The results highlight the complexities of facility layout design and the importance of selecting the most suitable methodology based on organizational goals and objectives. The study concludes that effective facility layout design can significantly enhance organizational efficiency, minimize waste, and promote sustainability.

Keywords: Facility layout design, Methodologies, Systematic Layout Planning, Activity Relationship Chart, Graph Theory, Simulation Modeling, Lean Layout Design, Sustainable Design, computer aided design.

1.0       Introduction

Facility layout and design refer to the strategic arrangement of physical resources, such as machinery, equipment, and workstations, within a production or service facility (Heragu, 2016). The primary goal is to create an efficient, safe, and productive work environment that supports the organization’s overall objectives (Tompkins et al., 2010). In highly competitive environments, effective facility layout plays a critical role in enhancing customer experience, improving workflow efficiency, and supporting employee responsiveness, all of which contribute to customer satisfaction and sustained patronage

1.1       Aims

The aims of facility layout and design include:

1. Improved Efficiency: Minimize distances, reduce transportation costs, and streamline workflows.

2. Increased Productivity: Optimize workspace utilization, reduce congestion, and enhance employee comfort.

3. Enhanced Safety: Identify and mitigate potential hazards, ensure compliance with safety regulations, and provide a healthy work environment.

4. Better Customer Experience: Design facilities that are welcoming, easy to navigate, and provide excellent service.

5. Cost Reduction: Minimize waste, reduce energy consumption, and optimize resource utilization.

1.2       Objectives

The objectives of facility layout and design include:

1. Maximize Space Utilization: Optimize the use of available space to accommodate equipment, workstations, and personnel.

2. Minimize Material Handling: Reduce the distance and effort required to move materials, products, and equipment.

3. Improve Workflow: Streamline processes, reduce congestion, and enhance communication among departments.

4. Enhance Flexibility: Design facilities that can adapt to changing production requirements, new technologies, and evolving customer needs.

5. Ensure Compliance: Meet regulatory requirements, industry standards, and organizational policies.

2.0       Literature review

Facility layout and design is a critical aspect of industrial production systems, as it directly impacts productivity, efficiency, and safety (Heragu, 2008). Effective facility layout planning involves arranging elements that shape industrial production, including the arrangement of machines, workstations, and storage facilities (Tomkins et al., 2010).

2.1       Key Components of Facility Layout Planning:

– Design Layout: The physical arrangement of facilities, including the location of machines, workstations, and storage facilities (Meller & Gau, 1996).

– Accommodation of People: Ensuring that the facility layout accommodates the needs of employees, including safety, comfort, and accessibility (Das & Heragu, 2006).

– Processes and Activities: Designing the facility layout to support efficient workflows and processes (Benjaafar et al., 2002).

Facility Layout Design Considerations:

– Plant location and design (Kumar et al., 2017)

– Structural design (Smith & Riera, 2015)

– Layout design (Drira et al., 2007)

– Handling systems design (Heragu, 2008)

– Risk assessment and mitigation (Taticchi et al., 2015)

2.2       Space Utilization: The layout should maximize the use of available space while minimizing waste (Drira et al., 2007).

2.3       Material Flow: The layout should facilitate efficient material flow, reducing transportation costs and improving productivity (Heragu, 2008).

2.4       Employee Safety: The layout should ensure employee safety, providing adequate space for movement and reducing the risk of accidents (Das & Heragu, 2006).

Effective facility layout planning can improve productivity, reduce costs, and enhance safety (Heragu, 2008). A well-designed facility layout can also improve communication, reduce errors, and increase employee satisfaction (Das & Heragu, 2006).

3.0       Methodologies and Tools

3.1       Systematic Layout Planning (SLP)

SLP is a structured approach to facility layout design, focusing on the relationship between departments and the flow of materials (Muther, 1973). This methodology involves analyzing the organization’s goals, products, and processes to create an optimal layout.

3.2       Activity Relationship Chart (ARC)

ARC is a graphical method used to analyze the relationships between different activities or departments within a facility (Muther, 1973). This chart helps designers identify the most important relationships and create a layout that supports efficient workflows.

3.3       Space Relationship Diagram (SRD)

SRD is a visual tool used to represent the relationships between different spaces or areas within a facility (Liggett, 2000). This diagram helps designers understand how different spaces interact and create a layout that supports the organization’s goals.

3.4       Graph Theory

Graph theory is a mathematical approach used to optimize facility layouts by representing the relationships between different nodes or departments (Tompkins et al., 2010). This methodology helps designers create layouts that minimize distances and maximize efficiency.

3.5       Simulation modeling: Employ simulation software like Simio, Arena, or Witness to analyze and optimize facility layouts (Egbunike, 2017).

3.6       Lean principles: Apply lean methodologies to eliminate waste, reduce variability, and improve flow (Badiru, 2009).

3.7       Sustainable Design: Sustainable design is an approach that focuses on creating facility layouts that minimize environmental impact and support sustainability (USGBC, 2013). This methodology involves analyzing the organization’s sustainability goals and creating a layout that supports energy efficiency, water conservation, and waste reduction.

3.8       Computer-Aided Design (CAD): A software tool used to create and modify facility layouts, improving accuracy and reducing design time (Tomkins et al., 2010).

4.0       Results

The study examined eight facility layouts and designs methodologies, including Systematic Layout Planning (SLP), Activity Relationship Chart (ARC), Space Relationship Diagram (SRD), Graph Theory, Simulation Modeling, Lean Layout Design, Sustainable Design and Computer Aided Design (CAD).

Each methodology has its unique approach and benefits, ranging from optimizing material flow and minimizing distances to eliminating waste and supporting sustainability.

4.1       Discussion

The results show that facility layout design is a complex task that requires careful consideration of various factors, including organizational goals, product and process requirements, and sustainability objectives. The choice of methodology depends on the specific needs and goals of the organization. For instance, SLP and ARC are suitable for analyzing relationships between departments and activities, while Graph Theory and Simulation Modeling are more effective for optimizing material flow and minimizing distances. Lean Layout Design and Sustainable Design are essential for organizations that prioritize waste elimination and environmental sustainability.

5.0       Conclusion

In conclusion, facility layout design is a critical aspect of organizational efficiency and effectiveness. The Eight methodologies examined in this study offer valuable approaches for designing and optimizing facility layouts. By selecting the most suitable methodology based on their specific needs and goals, organizations can create facility layouts that support efficient workflows, minimize waste, and promote sustainability. Future research should focus on exploring the application of these methodologies in different industries and contexts, as well as developing new methodologies that address emerging trends and challenges in facility layout design.

References

Apple, J. M. (1991). Material handling systems: Design, operation, and maintenance. McGraw-Hill.

Badiru, A. B. (2009). Handbook of industrial engineering equations, formulas, and calculations. CRC Press.

Banks, J., Carson, J. S., & Nelson, B. L. (2010). Discrete-event system simulation. Prentice Hall.

Benjaafar, S., Sheikhzadeh, M., & Gupta, D. (2002). Machine layout in manufacturing facilities. International Journal of Production Research, 40(7), 1449-1465.

Bitner, M. J. (1992). Servicescapes: The impact of physical surroundings on customers and employees. Journal of Marketing, 56(2), 57-71.

Das, S. K., & Heragu, S. S. (2006). A layered approach to facility layout design. International Journal of Production Research, 44(1), 147-166.

Drira, A., Pierreval, H., & Hajri-Gabouj, S. (2007). Facility layout design using ant colony optimization. International Journal of Production Research, 45(11), 2473-2493.

Egbunike, P. N. (2017). Facility layout design using simulation modeling. Journal of Engineering and Technology, 6(1), 1-10.

Hammer, M., & Champy, J. (1993). Reengineering the corporation: A manifesto for business revolution. HarperCollins.

Heragu, S. S. (2008). Facilities design. CRC Press.

Heragu, S. S. (2016). Facilities design. CRC Press.

International Organization for Standardization. (2015). ISO 9001:2015 Quality management systems — Requirements.

Jensen, J. B. (2017). Lean production and waste reduction. Journal of Cleaner Production, 142, 247-255.

Kotter, J. P. (2012). Leading change. Harvard Business Review Press.

Kulatilaka, N. (2017). Operations management: A focus on productivity. Journal of Operations Management, 49, 67-75.

Liggett, R. (2000). Space planning and layout. Journal of Facilities Management, 1(2), 131-144.

Meller, R. D., & Gau, K. Y. (1996). The facility layout problem: Recent and emerging trends and perspectives. Journal of Manufacturing Systems, 15(5), 351-366.

Muther, R. (1973). Systematic layout planning. Cahners Books.

Occupational Safety and Health Administration. (2020). Occupational Safety and Health Administration. Retrieved from https://www.osha.gov/

Oyedele, L. O. (2013). Computer-aided design of facility layouts. Journal of Engineering and Technology, 2(1), 1-8.

Smith, J. S., & Riera, B. (2015). Structural design of facilities. Journal of Building Engineering, 3, 144-153.

Sule, D. R. (2001). Manufacturing facilities: Location, planning, and design. PWS Publishing Company.

Taticchi, P., Tonelli, F., & Cagnazzo, L. (2015). Performance measurement and management: A literature review and a research agenda. International Journal of Production Research, 53(10), 3227-3245.

Tompkins, J. A., White, J. A., Bozer, Y. A., & Tanchoco, J. M. A. (2010). Facilities planning. John Wiley & Sons.

Okoye, J. N., & Nwokike, C. E. (2023). Service quality and consumer patronage in Roban Stores, Awka, Anambra State, Nigeria: Content analysis. Indonesian Marketing Journal, 3(2), 110–128.

U.S. Green Building Council. (2013). LEED v4 for building design and construction.

Womack, J. P., & Jones, D. T. (1996). Lean thinking: Banish waste and create wealth in your corporation. Simon and Schuster.