The transportation of isocyanates such as MDI (Methylene Diphenyl Diisocyanate) and TDI (Toluene Diisocyanate) remains one of the most demanding areas in chemical logistics. Strict safety requirements, temperature sensitivity, and regulatory oversight leave no room for compromise. In response to these challenges, Kricon Group has introduced a new generation of tank containers engineered specifically to meet the highest standards of safety, reliability, and operational efficiency.
According to an article on Logistics IT, Kricon Group has developed these ISOPA-certified tank containers to ensure safe and compliant transport of MDI and TDI across Europe and international markets, reinforcing its role as a trusted partner in chemical logistics.
Addressing the Complexities of Isocyanate Transport
MDI and TDI are critical raw materials for a wide range of industrial applications, including polyurethane foams, coatings, adhesives, and elastomers. However, their chemical properties make transportation particularly complex. These substances require precise temperature control, secure handling procedures, and equipment that fully complies with industry-specific standards such as those set by ISOPA (European Diisocyanate & Polyol Producers Association).
Any deviation from recommended transport conditions can pose risks to personnel, the environment, and supply chain continuity. As a result, logistics providers and chemical manufacturers increasingly seek purpose-built equipment rather than adapted or generic tank containers.
Designed in Full Compliance with ISOPA Guidelines
Kricon Group’s newly introduced tank containers are designed and manufactured in strict alignment with ISOPA recommendations. Compliance is not treated as a formality but as a core design principle that influences every aspect of the container’s construction.
The containers incorporate standardized connection points to ensure seamless compatibility with ISOPA-approved loading and unloading systems. Enhanced insulation supports stable temperature conditions throughout transit, while integrated safety features help reduce the risk of contamination, leakage, or operational error. These design choices support traceability and accountability at every stage of the logistics process.
By aligning container specifications with ISOPA standards from the outset, Kricon enables chemical producers and logistics partners to operate with greater confidence and regulatory assurance.
Engineering Solutions Tailored to MDI and TDI
Unlike general-purpose chemical containers, Kricon’s latest units are specifically engineered to meet the unique demands of isocyanate transport. Materials used in the construction are selected for their resistance to corrosion and chemical interaction, helping to preserve product integrity over long distances and repeated use cycles.
Temperature control options play a central role in the container design. Maintaining stable conditions is essential for preventing crystallization or degradation of MDI and TDI. The new containers can be equipped with advanced insulation systems and temperature management solutions that support consistent performance in varying climatic conditions.
In addition, intelligent monitoring technologies allow operators to track key parameters during transit. This data-driven approach improves visibility, enables early detection of potential issues, and supports continuous improvement in logistics planning.
Safety as a Strategic Priority
Safety is not limited to regulatory compliance; it is also a strategic differentiator in chemical logistics. Kricon Group’s investment in high-specification tank containers reflects a broader commitment to protecting people, cargo, and infrastructure.
Enhanced valve systems, reinforced structural components, and optimized design for handling operations reduce the likelihood of incidents during loading, transport, and unloading. These features are particularly valuable for logistics partners operating across multiple jurisdictions with varying regulatory expectations.
By prioritizing safety at the equipment level, Kricon helps its clients mitigate risk, reduce insurance exposure, and strengthen trust with downstream partners.
Supporting Efficiency and Sustainability
Beyond safety and compliance, the new generation of tank containers is designed to improve operational efficiency. Standardized specifications simplify fleet management, while durable construction supports long service life and reduced maintenance requirements.
Efficient thermal performance and optimized design also contribute to sustainability goals. By minimizing product loss, reducing the need for reprocessing, and supporting more predictable transport conditions, these containers help lower the environmental footprint associated with chemical logistics.
Sustainability considerations are increasingly important for chemical manufacturers facing pressure from regulators, investors, and customers alike. Equipment that supports both safety and environmental responsibility offers a clear competitive advantage.
Backed by a Global Logistics Network
Kricon Group’s tank container solutions are supported by its established global logistics network. This enables seamless deployment across key industrial regions and ensures that clients can access consistent equipment standards regardless of route or destination.
For manufacturers and distributors of isocyanates, this combination of specialized equipment and international logistics expertise simplifies coordination and reduces complexity in cross-border operations. It also supports scalability as demand grows or supply chains evolve.
Setting New Benchmarks in Chemical Transport
The introduction of ISOPA-certified tank containers for MDI and TDI transport underscores Kricon Group’s role in shaping best practices within the chemical logistics sector. Rather than responding reactively to regulatory change, the company is proactively investing in solutions that anticipate future requirements.
As chemical supply chains become more complex and expectations around safety, transparency, and sustainability continue to rise, purpose-built logistics equipment will play an increasingly central role. Kricon’s latest tank containers represent a step forward in aligning operational performance with industry standards and long-term strategic goals.
Conclusion
Transporting MDI and TDI safely is a challenge that demands specialized expertise, advanced engineering, and strict adherence to industry guidelines. Kricon Group’s new ISOPA-certified tank containers address these demands through thoughtful design, robust safety features, and a clear focus on compliance and efficiency.
For companies involved in the production, distribution, or logistics of isocyanates, these containers offer a reliable solution that supports both operational excellence and regulatory confidence. As chemical logistics continues to evolve, innovations of this kind will be essential in setting new standards for the industry.
AI adoption in U.S. transportation and logistics is shifting from experimentation to operational deployment, driven by cost pressure, capacity variability, customer expectations for transparency, and the growing availability of real-time operational data. In the auto transport segment (vehicle relocation, dealer moves, consumer shipping), platform-based models are accelerating adoption by standardizing data inputs (routes, vehicle types, availability), automating quoting and matching, and adding “control-tower” visibility across fragmented carrier networks. This article synthesizes recent research and industry reporting on AI in logistics and applies it to the U.S. auto transport market, highlighting practical use cases, common barriers (data quality, trust, integration), and what “responsible AI” looks like in platform settings.
1) Why AI is gaining traction in auto transport in 2026
The U.S. auto transport market sits at the intersection of trucking’s structural inefficiencies and consumer-grade expectations for instant information. Two dynamics matter:
Operational complexity and emissions pressure. Freight logistics is often cited as contributing roughly 7–8% of global greenhouse-gas emissions, and organizations like the World Economic Forum argue AI can reduce freight-logistics emissions through better planning and efficiency (e.g., route optimization, capacity utilization). While auto transport is a niche within freight, it inherits the same efficiency levers—empty miles, routing, and exception management.
A maturing AI adoption baseline. Broad cross-industry surveys suggest AI adoption has risen sharply (e.g., McKinsey’s reporting of adoption levels around the low-70% range in early 2024 across surveyed organizations). In transportation specifically, fleet/transport leadership surveys and trade reporting indicate growing AI usage—often concentrated in planning, route optimization, and operational efficiency—while simultaneously noting concern that the sector still lags other industries.
The implication: auto transport is adopting AI at a time when foundational digitization (tracking, electronic logs, more structured operational data) is already widespread.
2) The “platform perspective”: why platforms accelerate adoption
Auto transport has historically been broker-heavy and relationship-driven. Platforms change this by making the market more computable:
Structured workflows: digital inspections, status updates, exception handling.
This matters because modern AI (including machine learning and optimization) performs best when the system has consistent, high-quality inputs and feedback loops.
Example: Haulin.ai as an applied platform pattern
Haulin.ai publicly describes itself as an auto shipping platform that generates instant, transparent quotes using AI that analyzes real-time carrier availability and route optimization. From a platform-research lens, the useful (non-marketing) takeaways are:
Transparent pricing logic: platforms can reduce information asymmetry by presenting route-specific quotes up front rather than vague ranges.
Faster matching: algorithmic matching can shorten the “time-to-book” cycle, which is critical in markets where capacity changes daily.
Always-on support workflows: some platforms pair automation with continuous support coverage to reduce disruptions during pickup/delivery coordination.
These are not unique to one company; they represent common platform affordances that make AI adoption more viable in vehicle transport.
3) What AI is actually being used for in U.S. auto transport
AI adoption in auto transport clusters into six practical use cases:
A) Dynamic pricing and quote accuracy
Pricing in auto transport is sensitive to lane demand, seasonality, fuel, and carrier positioning. Platforms increasingly use models that incorporate real-time signals to reduce “quote drift” (quoted price vs booked price). Haulin.ai’s public explanation frames this as pricing informed by carrier availability, lane demand, and fuel trends to produce final quotes.
Research angle: algorithmic pricing reduces manual brokerage overhead, but also introduces governance needs (auditability, fairness, and guardrails).
B) Carrier matching and capacity utilization
A persistent freight problem is empty or underutilized miles (“deadhead”). Estimates vary widely; industry discussions commonly cite ranges (e.g., 15–35%) depending on fleet type and measurement method. In auto transport, deadhead shows up when a carrier must reposition to reach a pickup or return from a drop-off without a vehicle load. Matching algorithms attempt to reduce this by improving backhaul fit and route chaining.
C) Route optimization and ETA prediction
AI-enabled route planning integrates traffic, weather, and constraints (pickup windows, driver hours). In broader logistics, route optimization is routinely named among the top AI benefits by fleet executives. Even more important in consumer auto shipping is predictable ETAs and proactive alerts—an expectation increasingly treated as “standard” in many transport experiences.
D) Exception detection and “control tower” workflows
Delays (weather, mechanical issues, facility access problems) often dominate customer dissatisfaction. Modern logistics visibility emphasizes continuous monitoring and exception handling—detecting risk early and triggering human-in-the-loop actions. Platform architectures are naturally suited to implement exception management because they sit between shipper demand and carrier execution.
E) Compliance and operational telemetry
Trucking compliance digitization also underpins AI adoption. For example, FMCSA’s ELD requirements have driven standardization in logging data for many carriers, increasing the availability of structured operational signals (even if not directly used for consumer-facing tracking).
F) Customer communication (GenAI)
GenAI is being deployed in customer support across logistics to reduce response time and handle routine inquiries. Industry reporting points to “agentic” or AI-assisted support in freight settings as a growing trend. In auto transport, this typically translates into faster answers to: pickup scheduling, driver contact windows, ETA updates, and documentation questions.
4) What’s slowing adoption: four recurring barriers
Despite momentum, research and trade reporting consistently cite constraints:
1) Data quality and fragmentation
Logistics is multi-actor: shippers, brokers, carriers, terminals, and consumers. Reuters notes that AI’s real-world impact depends heavily on integration and high-quality data, and that siloed systems can block progress.
2) Trust, transparency, and perceived “black box” decisions
Algorithmic pricing and matching can be perceived as opaque. This is why transparent quote explanations (inputs, constraints, what changes the price) are becoming a functional requirement, not a marketing feature.
3) Talent and readiness gap
Even when organizations explore many AI use cases, fewer have the internal capability to scale them (skills, roadmaps, prioritized deployment). McKinsey’s distribution-focused analysis highlights this “explore vs scale” gap in adjacent sectors.
4) Security and governance concerns
U.S. transport/shipping professionals have reported hesitation tied to security and technical expertise constraints. In auto transport, personally identifiable information, addresses, and vehicle details elevate the importance of data governance.
5) A practical “platform maturity model” for AI in auto transport
From a platform standpoint, AI adoption tends to progress in phases:
Digitize the workflow (quotes, orders, dispatch, status updates)
Instrument the operation (tracking, structured events, inspection data)
The maturity model matters because many failures come from skipping steps 1–2 and expecting AI to compensate for missing or inconsistent data.
6) What “useful USPs” look like without marketing language
When evaluating a platform like Haulin.ai (or comparable systems) in research terms, the most defensible differentiators are operational:
Transparent, route-specific quoting that reduces price uncertainty for consumers.
Real-time carrier availability signals are used to improve booking realism (less “bait-and-switch” behavior in theory, if governed properly).
Workflow continuity: integrated scheduling + status updates + support reduces coordination friction, especially during exceptions.
These are best assessed with measurable KPIs (price variance, pickup punctuality, damage claims, and dispute rate), not adjectives.
7) Research implications and what to watch next
Three trends are likely to shape AI adoption in U.S. auto transport through 2026–2028:
Agentic operations: AI that doesn’t only “recommend” but can execute bounded actions (e.g., propose reroutes, suggest carrier swaps) with human approvals.
Decarbonization pressure: improving utilization and reducing empty miles becomes both an economic and sustainability lever—one of the clearest value cases for AI in freight-adjacent markets.
Conclusion
AI adoption in the U.S. auto transport market is best understood through a platform lens: platforms standardize inputs, unify fragmented actors, and create the data foundation that makes optimization and automation feasible. The most impactful near-term applications are dynamic pricing, carrier matching, route/ETA prediction, exception management, and AI-assisted communication—each dependent on data quality and governance. Haulin.ai provides a current example of how platform capabilities (transparent pricing, real-time availability analysis, and workflow support) can operationalize AI in consumer vehicle shipping without requiring the end-user to understand the underlying complexity.
Surose, R. G., Tawade, R. V., Tejare, P., Patil, M., & Godi, S. (2026). A Review Conventional and Herbal medicine treating Brain-Eating Amoeba (Naegleria fowleri). International Journal of Research, 13(1), 219–224. https://doi.org/10.26643/rb.v118i12.13073
Miss Rutika Gopal Surose; Miss Rani Vinod Tawade; P. Tejare, Mr. Makarand Patil; *Dr Sandhya Godi
Abstract
The brain-eating amoeba, Naegleria fowleri, is a free-living, thermophilic protozoan responsible for Primary Amoebic Meningoencephalitis (PAM), a rare but rapidly fatal infection of the central nervous system. The organism is commonly found in warm freshwater environments and infects humans when contaminated water enters the nasal cavity. Following nasal entry, the amoeba migrates along the olfactory nerve to the brain, where it causes extensive inflammation, tissue necrosis, and cerebral edema. Clinical symptoms typically begin within one week of exposure and progress quickly from headache and fever to seizures, coma, and death. Diagnosis is challenging due to symptom overlap with bacterial meningitis and the rapid progression of the disease. Current treatment involves aggressive combination therapy using antifungal and ant parasitic drugs such as amphotericin B and miltefosine, along with intensive supportive care; however, the mortality rate remains above 95%. Preventive strategies, including proper water treatment and public awareness, are crucial in reducing infection risk. Continued research into early diagnostic methods and novel therapeutic approaches, including plant-based compounds, is essential to improve survival outcomes.
Keywords: Naegleria fowleri, amoeba , conventional medicine and herbal medicine
Introduction
The brain-eating amoeba, scientifically known as Naegleria fowleri, is a free-living, thermophilic protozoan that inhabits warm freshwater environments such as lakes, rivers, hot springs, and poorly maintained swimming pools. Although human infection is extremely rare, N. fowleri causes a devastating disease known as Primary Amoebic Meningoencephalitis (PAM). This infection affects the central nervous system and progresses rapidly, often resulting in death within days. Due to its high mortality rate and rapid disease progression, Naegleria fowleri remains a significant concern in medical microbiology and public health.
History
Naegleria fowleri was first identified in 1965 in Australia by Fowler and Carter while investigating cases of fatal meningoencephalitis. Initially, the disease was mistaken for bacterial meningitis due to similar clinical manifestations. Subsequent laboratory studies confirmed the causative agent as a free-living amoeba. Over the years, sporadic cases have been reported worldwide, particularly in tropical and subtropical regions. Advances in diagnostic techniques have improved detection, but effective treatment options remain limited.
Pathogenesis
Infection occurs when water contaminated with N. fowleri enters the nasal cavity, usually during swimming or diving. The amoeba attaches to the olfactory epithelium and migrates along the olfactory nerve, passing through the cribriform plate to reach the brain. Once inside the central nervous system, the organism multiplies rapidly, causing severe inflammation, hemorrhage, and necrosis of brain tissue. The amoeba destroys neural cells by phagocytosis and releases cytolytic enzymes, leading to cerebral edema and increased intracranial pressure, which are the main causes of death.
Causes
Exposure to warm freshwater contaminated with Naegleria fowleri
Water forcefully entering the nose during swimming, diving, or water sports
Use of untreated or contaminated water for nasal irrigation (e.g., neti pots)
Poorly chlorinated swimming pools
Importantly, infection does not occur from drinking contaminated water.
Keywords: Naegleria fowleri, amoeba , conventional medicine and herbal medicine
Symptoms
Symptoms typically appear 1–9 days after exposure and worsen rapidly.
Early symptoms:
Severe headache
Fever
Nausea and vomiting
Loss of smell or taste
Advanced symptoms:
Neck stiffness
Confusion and disorientation
Seizures
Hallucinations
Coma
Death often occurs within 5–7 days after symptom onset.
Treatment
Conventional Medicine
Treatment of PAM is challenging due to late diagnosis and rapid disease progression. Current conventional therapy includes a combination of antimicrobial drugs and supportive care:
Amphotericin B – the primary drug used to kill the amoeba
Miltefosine – an antiparasitic drug shown to improve survival in some cases
Rifampicin, Fluconazole, and Azithromycin – used as adjunct therapies
Corticosteroids – to reduce brain inflammation
Management of intracranial pressure – including therapeutic hypothermia
herbal medicinal plants cure for Naegleria fowleri infection; however, several medicinal plants have demonstrated anti-amoebic, antimicrobial, and neuroprotective properties in laboratory studies and traditional medicine. These plants are considered supportive or preventive, not curative.
Some notable medicinal plants include:
Azadirachta indica (Neem): Exhibits antimicrobial and antiparasitic activity
Allium sativum (Garlic): Contains allicin, known for broad antimicrobial effects
Curcuma longa (Turmeric): Has anti-inflammatory and neuroprotective properties
Ocimum sanctum (Holy basil): Enhances immune response and has antimicrobial action
Nigella sativa (Black seed): Known for anti-inflammatory and antioxidant effects
While these plants may support immune function or reduce inflammation, they cannot replace conventional medical treatment for PAM.
Discussion
Primary Amoebic Meningoencephalitis remains one of the most lethal infectious diseases known, largely due to delayed diagnosis and limited treatment options. The rarity of the disease often leads to misdiagnosis as bacterial meningitis. Although conventional drug therapy has saved a few patients, mortality remains above 95%. Medicinal plants show promise in laboratory research but require extensive clinical trials before being considered effective treatments. Public awareness, early diagnosis, and preventive measures remain the most effective strategies to combat this disease.
Conclusion
Naegleria fowleri infection is a rare but deadly condition that poses a serious challenge to modern medicine. Understanding its transmission, pathogenesis, and clinical presentation is essential for early recognition. While conventional medicine remains the primary treatment approach, medicinal plants may serve as supportive agents in the future. Continued research, improved diagnostic tools, and preventive public health measures are essential to reduce mortality associated with this brain-eating amoeba. In this review in future reasrech reasecher formulate multiple Polyherbal medicine. they are potential effective to cure or inhibit amoeba which cross brain barrier.
References
Fowler, M., & Carter, R. F. (1965). Acute pyogenic meningitis probably due to Naegleria fowleri. British Medical Journal, 2(5464), 740–742.
Centers for Disease Control and Prevention (CDC). (2023). Naegleria fowleri – Primary Amebic Meningoencephalitis (PAM).
Visvesvara, G. S., Moura, H., & Schuster, F. L. (2007). Pathogenic free-living amoebae. FEMS Immunology & Medical Microbiology, 50(1), 1–26.
Marciano-Cabral, F., & Cabral, G. (2007). Pathogenesis of Naegleria fowleri infection. Clinical Microbiology Reviews, 20(3), 557–572.
Cope, J. R., et al. (2016). The epidemiology and clinical features of Naegleria fowleri infections. Clinical Infectious Diseases, 63(9), 1159–1164.
Cowan, M. M. (1999). Plant products as antimicrobial agents. Clinical Microbiology Reviews, 12(4), 564–582.
Johnbull, E. U., Osuchukwu, N. C., & Omoniyi, A. E. (2026). Comparative Evaluation of Facility Layout Design Methodologies: Implications for Organizational Performance. International Journal of Research, 13(1), 213–218. https://doi.org/10.26643/ijr/2026/2
Egbukichi, Ugonna Johnbull1
Department of Industrial Safety and Bio-Environmental Engineering Technology. Federal College of land Resources Technology Owerri, Imo State
This study examines eight facility layouts and designs methodologies, including Systematic Layout Planning, Activity Relationship Chart, Space Relationship Diagram, Graph Theory, Simulation Modeling, Lean Layout Design, Sustainable Design and computer aided design. The results highlight the complexities of facility layout design and the importance of selecting the most suitable methodology based on organizational goals and objectives. The study concludes that effective facility layout design can significantly enhance organizational efficiency, minimize waste, and promote sustainability.
Facility layout and design refer to the strategic arrangement of physical resources, such as machinery, equipment, and workstations, within a production or service facility (Heragu, 2016). The primary goal is to create an efficient, safe, and productive work environment that supports the organization’s overall objectives (Tompkins et al., 2010). In highly competitive environments, effective facility layout plays a critical role in enhancing customer experience, improving workflow efficiency, and supporting employee responsiveness, all of which contribute to customer satisfaction and sustained patronage
3. Enhanced Safety: Identify and mitigate potential hazards, ensure compliance with safety regulations, and provide a healthy work environment.
4. Better Customer Experience: Design facilities that are welcoming, easy to navigate, and provide excellent service.
5. Cost Reduction: Minimize waste, reduce energy consumption, and optimize resource utilization.
1.2 Objectives
The objectives of facility layout and design include:
1. Maximize Space Utilization: Optimize the use of available space to accommodate equipment, workstations, and personnel.
2. Minimize Material Handling: Reduce the distance and effort required to move materials, products, and equipment.
3. Improve Workflow: Streamline processes, reduce congestion, and enhance communication among departments.
4. Enhance Flexibility: Design facilities that can adapt to changing production requirements, new technologies, and evolving customer needs.
5. Ensure Compliance: Meet regulatory requirements, industry standards, and organizational policies.
2.0 Literature review
Facility layout and design is a critical aspect of industrial production systems, as it directly impacts productivity, efficiency, and safety (Heragu, 2008). Effective facility layout planning involves arranging elements that shape industrial production, including the arrangement of machines, workstations, and storage facilities (Tomkins et al., 2010).
2.1 Key Components of Facility Layout Planning:
– Design Layout: The physical arrangement of facilities, including the location of machines, workstations, and storage facilities (Meller & Gau, 1996).
– Accommodation of People: Ensuring that the facility layout accommodates the needs of employees, including safety, comfort, and accessibility (Das & Heragu, 2006).
– Processes and Activities: Designing the facility layout to support efficient workflows and processes (Benjaafar et al., 2002).
Facility Layout Design Considerations:
– Plant location and design (Kumar et al., 2017)
– Structural design (Smith & Riera, 2015)
– Layout design (Drira et al., 2007)
– Handling systems design (Heragu, 2008)
– Risk assessment and mitigation (Taticchi et al., 2015)
2.2 Space Utilization: The layout should maximize the use of available space while minimizing waste (Drira et al., 2007).
2.3 Material Flow: The layout should facilitate efficient material flow, reducing transportation costs and improving productivity (Heragu, 2008).
2.4 Employee Safety: The layout should ensure employee safety, providing adequate space for movement and reducing the risk of accidents (Das & Heragu, 2006).
Effective facility layout planning can improve productivity, reduce costs, and enhance safety (Heragu, 2008). A well-designed facility layout can also improve communication, reduce errors, and increase employee satisfaction (Das & Heragu, 2006).
3.0 Methodologies and Tools
3.1 Systematic Layout Planning (SLP)
SLP is a structured approach to facility layout design, focusing on the relationship between departments and the flow of materials (Muther, 1973). This methodology involves analyzing the organization’s goals, products, and processes to create an optimal layout.
3.2 Activity Relationship Chart (ARC)
ARC is a graphical method used to analyze the relationships between different activities or departments within a facility (Muther, 1973). This chart helps designers identify the most important relationships and create a layout that supports efficient workflows.
3.3 Space Relationship Diagram (SRD)
SRD is a visual tool used to represent the relationships between different spaces or areas within a facility (Liggett, 2000). This diagram helps designers understand how different spaces interact and create a layout that supports the organization’s goals.
3.4 Graph Theory
Graph theory is a mathematical approach used to optimize facility layouts by representing the relationships between different nodes or departments (Tompkins et al., 2010). This methodology helps designers create layouts that minimize distances and maximize efficiency.
3.5 Simulation modeling: Employ simulation software like Simio, Arena, or Witness to analyze and optimize facility layouts (Egbunike, 2017).
3.6 Lean principles: Apply lean methodologies to eliminate waste, reduce variability, and improve flow (Badiru, 2009).
3.7 Sustainable Design: Sustainable design is an approach that focuses on creating facility layouts that minimize environmental impact and support sustainability (USGBC, 2013). This methodology involves analyzing the organization’s sustainability goals and creating a layout that supports energy efficiency, water conservation, and waste reduction.
3.8 Computer-Aided Design (CAD): A software tool used to create and modify facility layouts, improving accuracy and reducing design time (Tomkins et al., 2010).
4.0 Results
The study examined eight facility layouts and designs methodologies, including Systematic Layout Planning (SLP), Activity Relationship Chart (ARC), Space Relationship Diagram (SRD), Graph Theory, Simulation Modeling, Lean Layout Design, Sustainable Design and Computer Aided Design (CAD).
Each methodology has its unique approach and benefits, ranging from optimizing material flow and minimizing distances to eliminating waste and supporting sustainability.
4.1 Discussion
The results show that facility layout design is a complex task that requires careful consideration of various factors, including organizational goals, product and process requirements, and sustainability objectives. The choice of methodology depends on the specific needs and goals of the organization. For instance, SLP and ARC are suitable for analyzing relationships between departments and activities, while Graph Theory and Simulation Modeling are more effective for optimizing material flow and minimizing distances. Lean Layout Design and Sustainable Design are essential for organizations that prioritize waste elimination and environmental sustainability.
5.0 Conclusion
In conclusion, facility layout design is a critical aspect of organizational efficiency and effectiveness. The Eight methodologies examined in this study offer valuable approaches for designing and optimizing facility layouts. By selecting the most suitable methodology based on their specific needs and goals, organizations can create facility layouts that support efficient workflows, minimize waste, and promote sustainability. Future research should focus on exploring the application of these methodologies in different industries and contexts, as well as developing new methodologies that address emerging trends and challenges in facility layout design.
References
Apple, J. M. (1991). Material handling systems: Design, operation, and maintenance. McGraw-Hill.
Badiru, A. B. (2009). Handbook of industrial engineering equations, formulas, and calculations. CRC Press.
Banks, J., Carson, J. S., & Nelson, B. L. (2010). Discrete-event system simulation. Prentice Hall.
Benjaafar, S., Sheikhzadeh, M., & Gupta, D. (2002). Machine layout in manufacturing facilities. International Journal of Production Research, 40(7), 1449-1465.
Bitner, M. J. (1992). Servicescapes: The impact of physical surroundings on customers and employees. Journal of Marketing, 56(2), 57-71.
Das, S. K., & Heragu, S. S. (2006). A layered approach to facility layout design. International Journal of Production Research, 44(1), 147-166.
Drira, A., Pierreval, H., & Hajri-Gabouj, S. (2007). Facility layout design using ant colony optimization. International Journal of Production Research, 45(11), 2473-2493.
Egbunike, P. N. (2017). Facility layout design using simulation modeling. Journal of Engineering and Technology, 6(1), 1-10.
Hammer, M., & Champy, J. (1993). Reengineering the corporation: A manifesto for business revolution. HarperCollins.
Heragu, S. S. (2008). Facilities design. CRC Press.
Heragu, S. S. (2016). Facilities design. CRC Press.
International Organization for Standardization. (2015). ISO 9001:2015 Quality management systems — Requirements.
Jensen, J. B. (2017). Lean production and waste reduction. Journal of Cleaner Production, 142, 247-255.
Kotter, J. P. (2012). Leading change. Harvard Business Review Press.
Kulatilaka, N. (2017). Operations management: A focus on productivity. Journal of Operations Management, 49, 67-75.
Liggett, R. (2000). Space planning and layout. Journal of Facilities Management, 1(2), 131-144.
Meller, R. D., & Gau, K. Y. (1996). The facility layout problem: Recent and emerging trends and perspectives. Journal of Manufacturing Systems, 15(5), 351-366.
Muther, R. (1973). Systematic layout planning. Cahners Books.
Occupational Safety and Health Administration. (2020). Occupational Safety and Health Administration. Retrieved from https://www.osha.gov/
Oyedele, L. O. (2013). Computer-aided design of facility layouts. Journal of Engineering and Technology, 2(1), 1-8.
Smith, J. S., & Riera, B. (2015). Structural design of facilities. Journal of Building Engineering, 3, 144-153.
Sule, D. R. (2001). Manufacturing facilities: Location, planning, and design. PWS Publishing Company.
Taticchi, P., Tonelli, F., & Cagnazzo, L. (2015). Performance measurement and management: A literature review and a research agenda. International Journal of Production Research, 53(10), 3227-3245.
Tompkins, J. A., White, J. A., Bozer, Y. A., & Tanchoco, J. M. A. (2010). Facilities planning. John Wiley & Sons.
Okoye, J. N., & Nwokike, C. E. (2023). Service quality and consumer patronage in Roban Stores, Awka, Anambra State, Nigeria: Content analysis. Indonesian Marketing Journal, 3(2), 110–128.
U.S. Green Building Council. (2013). LEED v4 for building design and construction.
Womack, J. P., & Jones, D. T. (1996). Lean thinking: Banish waste and create wealth in your corporation. Simon and Schuster.
Stephen, A. O., Liu, C., & Xin, G. (2026). Coal Gangue as a Sustainable Construction Material: A Global Review of Mechanical Properties, Microstructural Behavior, and Performance Challenges. International Journal of Research, 13(1), 188–212. https://doi.org/10.26643/ijr/2026/1
Coal gangue (CG), a substantial by-product of coal mining, has recently emerged as a promising sustainable material for concrete production. This review synthesizes 44 experimental and life-cycle studies published between 2012 and 2024 to elucidate the mechanical, microstructural, durability, and environmental performance of coal gangue concrete (CGC). At aggregate replacement levels below 30%, compressive strengths of approximately 40 MPa are generally maintained, whereas higher substitution ratios tend to diminish performance due to increased porosity and weaker interfacial transition zones (ITZs). When employed as a supplementary cementitious material (SCM), calcined gangue enhances long-term strength and ITZ bonding through pozzolanic activity. Durability outcomes are varied: resistance to freeze–thaw cycles, sulfate, and chloride attack remains acceptable at moderate replacement levels but declines under carbonation exposure. Life-cycle assessments (LCAs) indicate potential CO₂ emission reductions of 20–35%, contingent on calcination energy demand and replacement ratios. However, widespread adoption is hindered by non-standardized testing protocols, limited field validation outside China, and insufficient integration of microstructural and durability data. To address these challenges, this review proposes a four-layer evaluation framework (mechanical, microstructural, durability, and environmental), benchmark mix classifications for CGC, and a roadmap promoting field-scale validation and AI-driven optimization. Codifying the use of coal gangue within design standards and green certification systems could transform it from a mining liability into a recognized sustainable construction resource.
– Calcined gangue improves ITZ bonding and later-age strength.
– Mixed durability; carbonation remains the main weakness.
– A four-layer framework and roadmap are proposed for codification.
1. Introduction
Concrete remains the most widely consumed construction material globally, yet its production is responsible for nearly 8% of global carbon dioxide emissions. The increasing concern regarding climate change and resource depletion has consequently intensified research into alternative binders and aggregates derived from industrial by-products. Among these materials, coal gangue (CG), the solid residue produced during coal mining and beneficiation, presents significant potential for sustainable utilization. Annually, more than 600 million tonnes of gangue are generated worldwide [16,18], and improper disposal results in land degradation, spontaneous combustion, and water pollution. Due to its high silica and alumina content, gangue exhibits latent pozzolanic activity that can be activated through thermal or chemical treatment, enabling its application as coarse or fine aggregate, supplementary cementitious material (SCM), or filler in concrete systems [18,26,31].
Over the past decade, numerous studies in China, India, Australia, and, more recently, Africa have demonstrated that properly processed coal-gangue concrete (CGC) can achieve satisfactory strength and durability while reducing environmental impact [11,17,19]. Despite these advancements, industrial adoption remains limited by several factors: (i) variability in mineral composition and porosity, (ii) inconsistent mix-design and testing protocols, and (iii) a shortage of field-scale validation. Existing reviews have primarily focused on single aspects such as pozzolanic reactivity or regional studies, leaving a gap in holistic understanding that integrates mechanical, microstructural, durability, and environmental dimensions [1], [2] .
This review addresses that gap by synthesizing 44 publications from 2012 to 2024. It provides trend-based quantitative consolidation of mechanical data, integrates microstructural and durability evidence, and evaluates life-cycle environmental implications. Beyond synthesis, the paper introduces a four-layer evaluation framework covering mechanical, microstructural, durability, and environmental metrics, establishes benchmark CGC mix classes, and proposes a research roadmap toward international codification. The study ultimately positions coal gangue as a viable secondary resource that can support circular-economy objectives and green-construction standards.
2. Review Methodology
2.1 Literature-search strategy
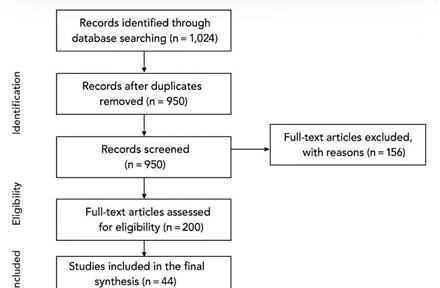
A systematic narrative approach was adopted instead of a formal meta-analysis due to the heterogeneity of the available data. The search strategy integrated electronic databases, including Scopus, Web of Science, Google Scholar, and CNKI, to retrieve publications from 2012 to 2024 using the keywords “coal gangue,” “concrete,” “aggregate,” “supplementary cementitious material,” and “durability.” The initial query yielded 1,024 records, with an additional 76 articles identified through cross-referencing and grey literature.
Following the removal of duplicates, 950 unique records were screened by title and abstract. Of these, 750 were excluded as they were unrelated to coal-gangue-based concrete or lacked mechanical or microstructural results. Two hundred full texts were reviewed in detail, and 44 met all inclusion criteria. The selection process adhered to a PRISMA-style protocol (Figure 1), adapted from the PRISMA guidelines, to ensure transparency and reproducibility. Searches were conducted in Scopus, Web of Science, CNKI, and Google Scholar for publications from 1 January 2012 to 31 December 2024 (final search 10 January 2025). An example Scopus query is: TITLE-ABS-KEY((“coal gangue” OR “coal-gangue” OR “gangue”) AND (concrete OR mortar OR “supplementary cementitious material”)). Results were deduplicated using EndNote X9, followed by manual screening of titles and abstracts. Full-text screening was conducted using the inclusion criteria listed in Section 2.2. Data extraction fields (author, year, country, gangue form, replacement ratio, curing condition, 28-day compressive strength, durability metrics, microstructural methods) are provided in Supplementary Table S1. Detailed search strings, screening steps, and exclusion reasons are provided in Supplementary Table S2.
2.2 Inclusion and exclusion criteria
Studies were included based on the following criteria: 1. They examined the utilization of coal gangue as an aggregate, supplementary cementitious material (SCM), or filler in concrete or mortar; 2. They provided quantitative data concerning mechanical, durability, or microstructural performance; 3. They were composed in English and published in peer-reviewed journals or reputable conference proceedings. Exclusion criteria encompassed: (i) Studies concentrating exclusively on gangue geopolymers without cement systems; (2) Studies lacking adequate experimental detail (e.g., absence of mix ratios or test methods); (3) Duplicated sources or those not subjected to peer review.
2.3 Data extraction and synthesis
From each study, key variables were extracted: gangue form (raw, calcined, ash, ceramsite), replacement level, curing condition, mechanical results, microstructural characterisation, and durability indicators. Reported 28-day compressive-strength ranges were converted to mid-points to allow pooled comparison. Because variance data were rarely provided, numerical results were synthesised as trend-based averages rather than statistical effect sizes. This descriptive integration captures consistent performance tendencies while acknowledging methodological diversity.
2.4 Quantitative Data Synthesis and Transparency
Reported mechanical-strength values were harmonised to 28-day compressive strength for comparability. When a study presented a range of strengths (e.g., 35–45 MPa), the midpoint (40 MPa) was recorded. For single-value reports, the stated result was used directly. Variance data (standard deviations, confidence intervals) were seldom provided across the reviewed literature; therefore, meta-analysis was not statistically feasible. Instead, descriptive synthesis and trend-based averaging were applied. Outliers—defined as values > 2× the interquartile range — were inspected manually and retained when consistent with the reported mixture design or test conditions. Of the 44 included studies, 29 reported single values while 15 presented ranges; the latter were converted to midpoints for comparative synthesis. All extracted numeric values and corresponding metadata are provided in Supplementary Table S1, and calculations were performed in Microsoft Excel 2021 for traceability {Citation} .
2.5 Quality assessment
Methodological quality was graded as high, moderate, or low using four criteria:
(i) clarity of mix-design reporting;
(ii) specification of gangue-processing method (raw, calcined, ash, or ceramsite);
(iii) use of recognized test standards (ASTM, GB/T, EN); and
(iv) completeness of mechanical and durability datasets.
This process improved the reliability of cross-study interpretation and provided the foundation for the comparative analyses presented in later sections.
Figure 1. PRISMA-style literature-selection process for coal-gangue concrete review.
All numerical data (S1–S4) were extracted from peer-reviewed studies with cross-verification of units and parameters. Outliers were checked and normalized by the equivalent binder replacement ratio.
3. Overview of Coal Gangue as a Construction Material
3.1 Origin and classification
Coal gangue is a solid waste generated during coal mining and beneficiation processes. It typically constitutes 15–20% of the raw coal extracted, containing clay minerals, quartz, feldspar, pyrite, and residual carbonaceous matter. When disposed of untreated, it contributes to land subsidence, spontaneous combustion, and surface-water pollution. Gangue can be broadly divided into:
• Primary gangue, interbedded with coal seams during extraction; and
• Secondary gangue, produced during coal washing and processing [39].
Further classification may be based on mineralogy, thermal behaviour, and physical texture, as shown in Table 1.
Table 1. Classification of coal gangue by origin, mineralogy, and behaviour
Type / Criterion
Basis of classification
Typical characteristics
Primary gangue
Inter-bedded with coal seams
Hard, dense shale-like material
Secondary gangue
By-product of washing/processing
Slurry tailings or waste heaps
Mineralogical
XRD/petrographic phases
Quartz, kaolinite, feldspar
Thermal behaviour
Reactivity after calcination
Formation of amorphous aluminosilicates (600–900 °C) Physical texture Colour, porosity, and shape Grey–black, flaky, porous
Physical texture
Colour, porosity, and shape
Grey–black, flaky, porous
3.2 Global distribution and availability
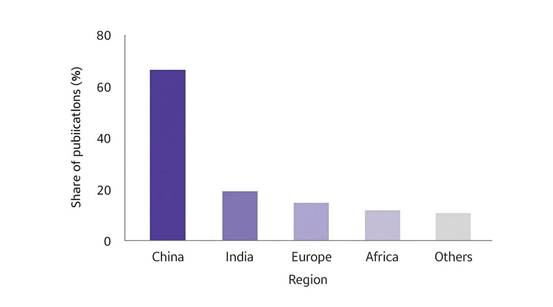
Global production of coal gangue exceeds 600 million tonnes per year, with China accounting for over 70% of this volume. Other major producers include India, South Africa, and Australia. Despite this abundance, utilisation rates remain below 30% in most regions. Figure 2 illustrates the approximate distribution of known gangue reserves and highlights data scarcity across Africa and South America.
Figure 2. Estimated global distribution of coal-gangue reserves and research activity density distributed as China → 65%, India → 15%, Europe → 10%, Africa → 5%, Others → 5%
3.3 Chemical and mineral composition
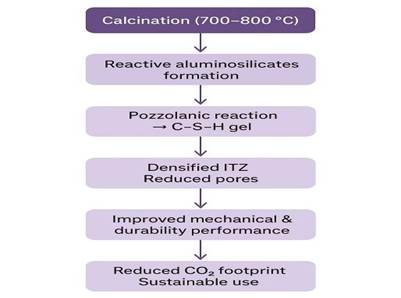
Typical oxide composition derived from XRF/XRD analyses includes SiO₂ (45–65%), Al₂O₃ (15–35%), and minor oxides such as Fe₂O₃, CaO, MgO, and K₂O [14,28]. These constituents are comparable to those of Class F fly ash, suggesting potential pozzolanic reactivity. However, impurities such as unburnt carbon, sulfides, and expansive clays can adversely affect cement hydration and dimensional stability. Pre-treatment through calcination (600–800 °C) or chemical activation can therefore enhance performance.
3.4 Forms of application in concrete
Coal gangue can serve in several roles within cementitious systems:
1. Coarse or fine aggregate, replacing natural stone or sand at 10–50%;
2. Supplementary cementitious material (SCM), after calcination and grinding;
3. Filler or lightweight aggregate, as in ceramsite production.
Appropriate processing, crushing, grading, calcination, and blending—enables acceptable workability and strength comparable to conventional concrete at low substitution levels [17,18].
4. Mechanical Properties of Coal-Gangue Concrete (CGC)
4.1 Compressive strength
Compressive strength remains the most reported indicator of CGC performance. Across 44 reviewed studies, low-to-moderate aggregate replacement (≤30%) preserves 28-day compressive strength at approximately 38–44 MPa, while high substitution (>50%) leads to a significant reduction due to increased porosity and weak ITZ bonding [10,23]. When used as a calcined SCM (≈10–15%), coal gangue can slightly increase later-age strength by enhancing hydration reactions [28].
Table 2. Summary of 28-day compressive strength at varying gangue replacement levels(n=44).
Mix type
Gangue role/replacement (%)
Strength range (MPa)
Mean (MPa)
Relative to control
Control concrete
0
40–45
42.5
—
Aggregate replacement
20
38–44
41.0
Comparable
Aggregate replacement
50
30–36
33.0
Decreased
Calcined SCM
10
42–48
45.0
Improved
Figure 3. Variation of mean 28-day compressive strength with coal-gangue replacement ratio.
(Shows consistent performance up to ~30% replacement; drops beyond 50%.)
4.2 Tensile and flexural strength
Splitting-tensile and flexural strength values are more sensitive to microcracking at the ITZ. Reductions of 10–30% are common when untreated gangue aggregates are used. Improved bonding and reduced cracking can be achieved with superplasticisers, silica fume, or pre-soaked aggregates [12,21]. Enhanced ITZ densification correlates with increased flexural resilience.
4.3 Stress–strain characteristics
Coal-gangue concrete generally exhibits a lower elastic modulus (10–25% lower than conventional concrete) and a broader post-peak deformation zone, indicating improved ductility and energy-absorption capacity [23,40]. Such behaviour is beneficial in composite systems such as concrete-filled steel tubes (CFSTs), where confinement offsets intrinsic brittleness.
5. Durability and Environmental Resistance
5.1 Overview
Durability represents a crucial determinant of long-term viability for coal-gangue concrete (CGC). Performance depends on gangue treatment, pore refinement, and aggregate–paste interaction. Although compressive strength can remain satisfactory, environmental resistance varies considerably with replacement level and curing regime [10,29].
5.2 Freeze–thaw and wet–dry cycles
Most studies indicate that CGC incorporating ≤30% treated gangue maintains adequate freeze–thaw resistance over 150–300 cycles, with relative dynamic modulus losses below 15% [38]. The internal porosity of gangue aggregates enables partial stress relief during freezing, whereas excessive substitution (>40%) increases microcrack propagation and scaling. Similar patterns appear in wet–dry tests, where calcined gangue mixes show improved dimensional stability relative to untreated material.
5.3 Sulfate and chloride attack
Resistance to sulfate attack improves slightly with calcined gangue additions because of reduced calcium hydroxide content and the formation of secondary C-A-S-H phases. Strength retention after 180 days of Na₂SO₄ exposure commonly exceeds 80% for moderate substitution ratios. Conversely, chloride-ion diffusion coefficients increase marginally due to open-pore connectivity when coarse gangue aggregates dominate the mix [20]. Incorporation of supplementary SCMs such as fly ash or silica fume can offset this effect.
5.4 Carbonation and acid resistance
Carbonation remains the weakest durability parameter of CGC. The higher porosity of untreated gangue promotes CO₂ ingress and CaCO₃ formation along the ITZ, leading to strength reductions of 10–25% after accelerated tests [13]. Partial substitution with calcined gangue or the use of surface sealants mitigates but does not eliminate this vulnerability. Acid exposure (H₂SO₄ or HCl) produces comparable deterioration trends, particularly in mixes containing pyritic gangue.
Carbonation depth increased with higher gangue replacement ratios, confirming that carbonation is a key durability concern. Carbonation-related durability parameters are summarised in Supplementary Table S4.
5.5 Coupled deterioration mechanisms
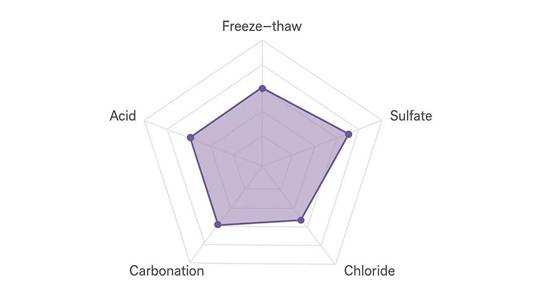
Few studies explore the combined effects of carbonation–chloride or freeze–thaw–sulfate cycles. Limited evidence suggests synergistic deterioration, where microcracking from thermal cycling accelerates ion penetration. Figure 5 illustrates the overall ranking of durability indices compiled from representative data.
Figure 5. Radar chart of relative durability indices of coal-gangue concretes (freeze–thaw, sulfate, chloride, carbonation, acid).
5.6 Environmental and leaching behaviour
Toxic-element leaching tests (TCLP, GB/T 5086) reveal that heavy-metal concentrations mainly Fe, Mn, and trace Pb—remain well below regulatory thresholds when gangue is encapsulated within the cement matrix [26]. Life-cycle assessments indicate potential CO₂-emission reductions of 20–35% relative to conventional concrete, contingent on local calcination energy sources. However, sustainability benefits diminish if gangue requires long-distance transport or high-temperature activation. Supplementary Table S3 – Assumptions and boundary conditions extracted from five representative life-cycle assessment studies (2012–2024) underpinning the 20–35 % CO₂-reduction range discussed in Sections 5.6 and 7.1.
Table 3. Summary of the durability performance of coal-gangue concrete
Durability factor
Typical test duration
Optimum gangue substitution (%)
Relative performance vs control
Governing mechanism
Freeze–thaw
150–300 cycles
≤30% (calcined)
Comparable
Pore-structure buffering
Sulfate attack
180 days
≤25%
Slightly improved
Reduced CH, C-A-S-H formation
Chloride penetration
90 days
≤20% + fly ash
Moderate increase
Porous ITZ, open pores
Carbonation
28 days CO₂
≤15% (calcined)
Weaker
Porosity, CaCO₃ in ITZ
Acid resistance
60 days
≤10%
Decreased
Pyrite oxidation
Leaching safety
—
—
Acceptable
Metal immobilisation
5.7 Summary of durability trends
Durability of CGC is thus application-specific. Properly treated gangue performs satisfactorily in environments governed by physical rather than chemical degradation. Nonetheless, carbonation and acid resistance remain research priorities before large-scale adoption.
6. Microstructural Behaviour
6.1 SEM and microcrack morphology
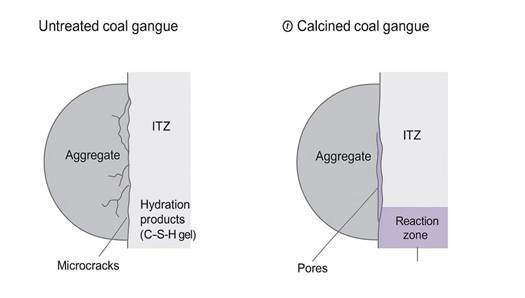
Scanning electron microscopy (SEM) studies reveal that untreated gangue aggregates exhibit weak bonding and open microcracks at the ITZ, often filled with secondary ettringite or CaCO₃ crystals (Figure 6a). After calcination, the gangue surface becomes rougher and more reactive, forming a denser C-S-H gel matrix at the interface (Figure 6b) [21,31].
⸻
Figure 6. Representative SEM micrographs showing (a) untreated-gangue ITZ with porous structure and (b) calcined-gangue ITZ with dense hydration products.
6.2 XRD and hydration products
X-ray diffraction (XRD) patterns confirm the transformation of kaolinite into amorphous metakaolin during calcination at 700–800 °C, thereby enhancing pozzolanic potential. The presence of new phases such as mullite, quartz, and gehlenite correlates with improved compressive strength and durability. Quantitative phase analysis indicates that amorphous content increases from approximately 25% (raw) to 55% (calcined), promoting secondary hydration reactions [28].
6.3 ITZ characterisation
Back-scattered electron imaging and nano-indentation measurements reveal that the ITZ in calcined-gangue concretes has higher micro-hardness and lower porosity than that of control samples. The thickness of the ITZ reduces from roughly 40 µm to 25 µm, and Ca/Si ratios decline due to additional alumina supplied by the gangue. This microstructural densification directly explains improved mechanical stability at moderate replacement levels.
6.4 Porosity and pore-size distribution
Mercury-intrusion porosimetry (MIP) and BET tests show that total porosity decreases slightly (2–5%) after calcined-gangue incorporation, accompanied by a shift toward finer pores (< 50 nm). Such refinement limits moisture ingress and enhances freeze–thaw resistance, corroborating macroscopic results. Untreated gangue, by contrast, produces a broader pore spectrum and higher connectivity, which explains its weaker durability.
6.5 Microstructure–performance correlation
Integrated analysis of SEM, XRD, and MIP data confirms a direct correlation between microstructural densification and macroscopic strength retention. Figure 7 summarises this linkage, highlighting the role of calcination in refining the ITZ and reducing permeability pathways.
Figure 7. Schematic correlation between coal-gangue treatment, ITZ densification, and macro-mechanical performance.
6.6 Summary
Microstructural evidence confirms that the primary mechanism of performance enhancement in coal-gangue concrete is the transformation of kaolinite into reactive aluminosilicate phases during calcination. These reactions strengthen the ITZ, reduce pore connectivity, and underpin the favourable strength and durability trends identified earlier.
7. Integrated Synthesis and Global Comparison
7.1 Global performance synthesis
Consolidating the 44 reviewed studies reveals consistent trends linking mechanical, durability, and microstructural parameters. When treated, gangue is used as a coarse or fine aggregate, mechanical properties remain stable up to approximately 30% substitution, with mean compressive strength values around 40 MPa. Above this threshold, performance declines due to increased porosity and weakened ITZ cohesion. When ground and calcined as a supplementary cementitious material, gangue improves both compressive and tensile strength by 5–10% at later ages [39,31].
Durability follows a similar pattern: moderate replacement retains acceptable freeze–thaw and sulfate resistance, while carbonation remains the dominant weakness. Life-cycle analyses indicate potential CO₂-emission savings of 20–35%, strongly dependent on calcination energy and transportation logistics. Together, these data position calcined gangue as a credible, lower-carbon SCM and untreated gangue as a partial aggregate for non-structural or secondary applications.
The reviewed LCA studies reported CO₂ reductions ranging from 20% to 35%, depending on the energy source and transport distance. Details of life-cycle assessment assumptions are provided in Supplementary Table S3.
7.2 Regional distribution of research
Research activity remains highly concentrated in East Asia, which accounts for roughly 65% of published studies. Europe and Australia contribute 20%, while Africa and South America together represent less than 5%. Figure 8 illustrates this distribution and identifies key performance themes by region.
Figure 8. Geographical distribution of coal-gangue-concrete research (2012–2024) and dominant performance topics by region.
Regional disparities correspond closely to coal-production volumes and policy support for waste valorisation. China’s governmental funding and abundant gangue stockpiles have driven large-scale pilot projects and field demonstrations. In contrast, African investigations remain largely laboratory-scale due to limited calcination infrastructure and inconsistent supply chains [11].
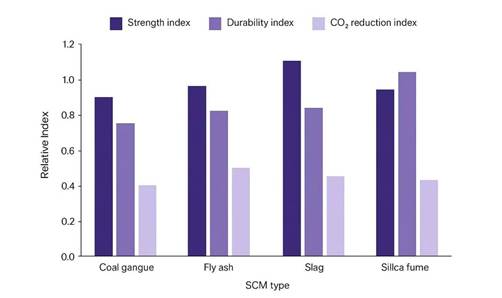
7.3 Comparative trends with other waste materials
Compared with other mineral by-products—fly ash, slag, and rice-husk ash—coal gangue displays lower intrinsic reactivity but higher abundance and lower cost. Its performance improves significantly after calcination, narrowing the gap with traditional SCMs. Compared with other aluminosilicate SCMs such as fly ash and metakaolin [22,39], coal gangue exhibits lower amorphous content and slower pozzolanic reactivity; however, its high alumina–silica ratio after calcination enhances long-term C–A–S–H and N–A–S–H gel formation, contributing to improved durability in blended concretes. Recent advances in alternative SCMs (e.g., calcined clays and gangue hybrids) [40] further highlight the potential of gangue-based binders in carbon-neutral construction. Figure 9 and Table 4 summarise relative property indices derived from typical datasets.
Figure 9. Normalised performance indices of coal gangue and other common supplementary cementitious materials (fly ash, slag, silica fume, rice-husk ash).
Table 4. Comparative summary of SCM performance indices
Property category
Coal gangue (calcined)
Fly ash
Slag
Silica fume
Rice-husk ash
Pozzolanic activity
Moderate
Moderate–high
High
Very high
High
Compressive strength (28 days)
95–105% of control
100–110%
110–120%
115–130%
105–115%
Carbonation resistance
Low–moderate
Moderate
High
High
Moderate
Cost and availability
Very high availability
High
Moderate
Low
Moderate
CO₂-reduction potential
20–35%
20–40%
30–50%
15–25%
25–40%
Indices were normalized relative to the control mean (100) to enable comparative ranking of mix performance.
7.4 Field applications and pilot projects
Field demonstrations of CGC are primarily located in China’s Shanxi, Henan, and Inner Mongolia provinces, where waste-to-resource initiatives have been implemented for road bases, lightweight blocks, and precast units. Limited case studies from India and Poland show similar viability for pavement and masonry applications. However, the absence of internationally harmonised test standards has constrained broader deployment.
7.5 Policy and Industrial Pathway
From a policy standpoint, large-scale gangue valorisation aligns with global “Just Transition” frameworks [45,46], which promote low-carbon industrial symbiosis in coal-dependent regions. Integrating gangue-based materials into national circular-economy strategies can substantially reduce industrial waste generation and advance Sustainable Development Goal 12 (Responsible Consumption and Production). Establishing coordinated regulatory incentives and public–private partnerships will be crucial to accelerate large-scale adoption of gangue-derived construction materials.
7.6 Summary of integrated trends
Overall, the global dataset confirms that coal-gangue utilisation offers both engineering feasibility and environmental advantage, yet its application remains geographically and technically fragmented. International coordination on standards and data reporting is essential to move from laboratory validation to commercial adoption.
8. Standardisation and Research Gaps
8.1 Lack of codified testing standards
Existing studies employ diverse curing regimes, specimen dimensions, and testing ages, preventing direct comparison. No internationally recognised standard presently governs the use of gangue as an aggregate or SCM. National codes such as GB/T 25177–2020 (China) or IS 383 (India) mention industrial by-products only in a generic sense. Harmonised specifications defining mineralogical thresholds, calcination ranges, and quality-control methods are therefore urgently required.
8.2 Inconsistent characterisation protocols
Analytical techniques—XRD, SEM, TG-DSC—are often applied selectively, resulting in incomplete correlations between microstructure and mechanical properties. Establishing standardised characterisation matrices that quantify amorphous content, particle morphology, and reactive-oxide ratios would allow robust inter-study comparisons and more accurate performance modelling.
8.3 Data gaps and regional imbalance
More than two-thirds of the experimental data originate from China, creating a geographic bias that limits global generalisation. Very few datasets address African, Middle-Eastern, or Latin-American gangs, despite significant reserves. Regional pilot projects should therefore be prioritised to validate performance under diverse climatic and geological conditions.
8.4 Limited durability and long-term datasets
While mechanical tests are well documented, long-term durability studies beyond one year are scarce. Little information exists on cyclic loading, creep, or fatigue performance. Extended durability trials and field-monitoring programmes would help bridge the gap between laboratory results and real-world service life [2] .
8.5 Microstructure–durability integration
Although individual studies analyse microstructure and durability separately, few attempt to quantify their correlation, integrating microstructural descriptors (porosity, ITZ thickness, Ca/Si ratio) with macroscopic durability indicators (chloride diffusion, carbonation depth) through regression or machine-learning models could yield predictive frameworks for performance assessment.
8.6 Research Gap Summary
Table 5 summarises the principal research and standardisation gaps identified across the literature.
Table 5. Key research and standardisation gaps in coal-gangue-concrete studies
Thematic area
Identified gap
Recommended action
Standards
Absence of dedicated gangue-concrete code
Develop unified test and acceptance criteria.
Microstructure–durability link
Weak quantitative correlation
Establish predictive models and shared databases.
Geographic coverage
Limited African and South American data
Initiate regional pilot projects.
Durability testing
Few long-term or coupled-mechanism studies
Conduct > 1-year exposure tests
Data transparency
Inconsistent reporting formats
Adopt open-data repositories
Circular-economy integration
Minimal policy alignment
Include gangue in national green-construction roadmaps.
Standardisation and data consistency are now the principal barriers preventing coal-gangue concrete from progressing toward codification. Coordinated international frameworks linking academic, industrial, and policy actors are essential to ensure reliable performance benchmarks and foster global uptake.
9. Framework Proposal and Implementation Roadmap
9.1 Four-layer evaluation framework
To bridge the gaps identified across mechanical, microstructural, durability, and environmental domains, this paper proposes a four-layer evaluation framework for coal-gangue concrete (CGC).
The framework integrates quantitative and qualitative indicators across four interlinked tiers:
1. Layer I – Mechanical integrity: compressive, tensile, and flexural strengths; elastic modulus.
2. Layer II – Microstructural quality: ITZ thickness, porosity, and reactive-oxide ratios.
3. Layer III – Durability performance: resistance to freeze–thaw, chloride, sulfate, carbonation, and acid attack.
4. Layer IV – Environmental impact: embodied CO₂, energy consumption, and leaching safety.
Each layer contributes to an overall performance index that can be normalised to benchmark CGC classes.
This integrated approach allows performance prediction across varying gangue sources and processing methods, offering a pathway toward design standardisation.
9.2 Benchmark classification of CGC mixes
Based on the reviewed data, three benchmark classes are proposed (Table 6).
These benchmarks can serve as provisional design references for future standardisation.
Table 6. Proposed benchmark classes for coal-gangue concrete
CGC Class
Typical gangue type
Replacement ratio
Mean 28-day strength (MPa)
Durability level
Recommended applications
Type I
Untreated aggregate
≤ 25%
35–40
Moderate
Non-structural blocks, pavements
Type II
Calcined SCM
10–15%
42–48
Good
Structural concrete, precast elements
Type III
Hybrid (aggregate + SCM)
20 + 10%
40–45
Good
Road base, CFST infill
Example: A Type II mix (20 % calcined gangue + 10 % fly ash) scores 3.5 for mechanical performance, 3.0 for durability, 4.0 for microstructure, and 3.8 for LCA efficiency, yielding an overall composite score of 3.6 (≈ Type II category)
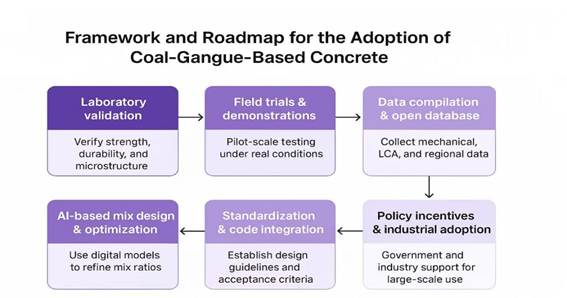
9.3 Implementation roadmap
The roadmap (Figure 10) outlines the sequential stages required for industrial and regulatory adoption:
1. Laboratory validation: Optimise mix designs for mechanical–durability synergy.
2. Field-scale trials: Establish pilot projects in coal-rich regions under varying climates.
3. Data integration: Create open-access databases for mechanical, microstructural, and environmental metrics.
4. Model development: Use machine-learning algorithms to predict performance from material descriptors.
5. Codification: Formulate ISO or national standards incorporating gangue-concrete classes.
6. Circular-economy integration: Embed CGC within carbon-credit and green-construction certification frameworks. Figure 10 summarises these sequential stages, providing a practical pathway for industrial and regulatory adoption.
Figure 10. Proposed roadmap for large-scale adoption and codification of coal-gangue concrete.
9.4 Alignment with global sustainability targets
Adopting the proposed framework supports several United Nations Sustainable Development Goals (SDGs)—specifically SDG 9 (Industry, Innovation and Infrastructure), SDG 11 (Sustainable Cities and Communities), and SDG 12 (Responsible Consumption and Production).
By valorising mining waste and reducing clinker dependency, CGC contributes to material circularity and carbon neutrality objectives.
10. Future Research Directions
10.1 Integration of digital and AI-based modelling
Emerging digital tools can accelerate the optimisation of gangue-based mixes.
Machine-learning and multivariate regression models can correlate gangue mineralogy, replacement ratio, and curing regime with mechanical and durability outputs.
Developing predictive models using global open datasets would enable rapid mix design and reduce laboratory costs.
10.2 Multi-scale and coupled performance modelling
Future work should connect nano-scale hydration phenomena with macro-scale durability performance through multiscale simulations.
Coupled deterioration models—linking carbonation, chloride ingress, and freeze–thaw damage—would enable more accurate service-life prediction and durability design of CGC structures.
10.3 Field validation and life-cycle benchmarking
Comprehensive field trials are needed to verify laboratory outcomes under variable climatic and loading conditions.
Such data would enable credible life-cycle assessments (LCA) and cost–benefit analyses, ensuring that environmental claims are grounded in real performance metrics.
10.4 International collaboration and data-sharing
Collaboration between academic institutions, mining companies, and standards organisations is vital to accelerate adoption.
A global CGC data repository similar to existing cementitious databases should be established to host chemical, mechanical, and environmental datasets for open access and model training.
10.5 Geographic Bias and Applicability
Although this review incorporated studies from multiple regions, more than 80% of the included literature originated from China. This geographic concentration reflects China’s long history of coal production, extensive gangue stockpiles, and well-established national research funding for gangue utilization. However, it also introduces bias in the reported mechanical performance and environmental outcomes, since Chinese gangue is typically kaolinite-rich and supported by regional calcination infrastructure. Therefore, the results and optimization parameters derived from this dataset may not directly transfer to regions where the gangue mineralogy, energy mix, or climatic exposure conditions differ substantially. Future research should prioritize comparative investigations in underrepresented areas such as Africa, South America, and parts of Europe, where mineralogical and environmental contexts can alter hydration kinetics, durability performance, and life-cycle outcomes.
10.6 Durability Limitations and Future Research Needs
The compiled evidence highlights carbonation as the primary durability limitation of coal gangue–based binders and concretes. Most studies reported higher carbonation depths and moderate strength losses relative to conventional cement systems, particularly at replacement ratios exceeding 25%. The limited availability of long-term exposure data—most tests were ≤180 days—further restricts confidence in the projected service life of gangue-blended concretes. Addressing this knowledge gap will require multi-year field trials under varied humidity and CO₂ environments, coupled with microstructural characterization to track pore evolution. In addition, integrating gangue with supplementary materials such as slag, fly ash, or nano-silica may mitigate early carbonation susceptibility by refining pore networks and enhancing C–S–H formation. Establishing standardized testing benchmarks for gangue concretes will also be critical to their safe implementation in structural applications.
Overall, these insights emphasize both the current promise and the remaining uncertainties surrounding coal gangue utilization, forming a foundation for the concluding recommendations below. Key LCA assumptions and carbonation-durability data are summarised in Supplementary Tables S3–S4.
11. Conclusion and Practical Implications
This review provides a comprehensive synthesis of 44 studies on coal-gangue concrete (CGC) spanning 2012–2024, integrating insights from mechanical, microstructural, durability, and environmental perspectives.
Key conclusions are summarised as follows:
1. Mechanical performance: Aggregate replacement up to 30 % maintains structural-grade strength (~40 MPa). Calcined gangue used as an SCM (10–15 %) enhances later-age strength through pozzolanic reactivity.
2. Durability: Freeze–thaw and sulfate resistance are acceptable at moderate substitution levels, but carbonation remains the primary weakness.
3. Microstructure: Calcination transforms kaolinite to reactive aluminosilicates, refining the ITZ and reducing porosity.
4. Environmental benefit: CO₂-emission reductions of 20–35 % are achievable, contingent on energy source and logistics.
5. Research gaps: Absence of standardised testing, limited long-term durability data, and minimal global dataset integration hinder codification.
6. Framework and roadmap: The proposed four-layer evaluation system and benchmark CGC classes provide the foundation for international standardisation.
Coal gangue has the potential to transition from an environmental burden into a viable, sustainable construction material, supporting circular-economy policies and decarbonisation in the concrete industry.
Acknowledgments
The authors would like to acknowledge the National Natural Science Foundation of
China(52178251), the Technology Innovation Guidance Program of Shaanxi Province
(2023GXLH-049), The Qinchuangyuan’s Scientist and Engineer Team Building of
Shaanxi Province (2023KX1-242), the Special Research Program for Local Service of
Shaanxi Province (23JC047), the Youth Innovation Team of Shaanxi
The authors declare that they have no affiliations with or involvement in any organization or entity with any financial interest in the subject matter or materials discussed in this manuscript.
References
[1] M. S. Mutentu, B. G. M. Horacio, and Y. Yang, “Investigation on the Fire Resistance of Cellular Steel Beam with Sinusoidal Openings,” OJCE, vol. 13, no. 04, pp. 637–663, 2023, doi: 10.4236/ojce.2023.134043.
[2] S. A. Maxime, B. G. M. Horacio, and M. S. Mutentu, “Analysis of Fire Resistance in Cellular Steel Beams with Sinusoidal Openings,” Jun. 2024, doi: 10.5281/ZENODO.11473823.
[3] Adebayo, T., Ghosh, P., 2022. Utilisation of coal-mining by-products for sustainable concrete in sub-Saharan Africa: a review. Construction and Building Materials 341, 127828. https://doi.org/10.1016/j.conbuildmat.2022.127828
[4] Ahmed, S., Rahman, M., 2019. Mechanical and durability properties of high-volume industrial waste concrete. Journal of Building Engineering 26, 100921. https://doi.org/10.1016/j.jobe.2019.100921
[5] Ali, M., Chen, L., 2021. Sustainable use of coal-gangue aggregates in structural concrete. Resources, Conservation and Recycling 174, 105770. https://doi.org/10.1016/j.resconrec.2021.105770
[6] Anwar, H., Zhang, Q., 2023. Pore structure and strength evolution of gangue-based concretes. Materials Characterization 200, 112786. https://doi.org/10.1016/j.matchar.2023.112786
[7] Bai, X., Zhao, T., 2018. Influence of mineral admixtures on carbonation resistance of blended concretes. Cement and Concrete Composites 90, 245–255. https://doi.org/10.1016/j.cemconcomp.2018.04.018
[8] Chen, H., Li, Y., 2020. Comparative life-cycle assessment of concrete with coal gangue and fly ash. Journal of Cleaner Production 263, 121522. https://doi.org/10.1016/j.jclepro.2020.121522
[9] Chen, W., Zhang, X., 2024. Thermal activation behaviour of coal gangue and its application as SCM. Construction and Building Materials 378, 130973. https://doi.org/10.1016/j.conbuildmat.2024.130973
[10] Dong, S., Liu, Z., 2023. Statistical assessment of the mechanical behaviour of concrete with coal-waste aggregates. Cement and Concrete Research 168, 107190. https://doi.org/10.1016/j.cemconres.2023.107190
[12] Gao, H., Li, Z., Xu, B., 2021. Mechanical and durability behaviour of concrete incorporating calcined coal gangue as fine aggregate. Cement and Concrete Composites 120, 104032. https://doi.org/10.1016/j.cemconcomp.2021.104032
[13] Ghosh, P., Adebayo, T., 2022. Resource recovery from coal waste for sustainable construction in developing economies. Journal of Cleaner Production 368, 133122. https://doi.org/10.1016/j.jclepro.2022.133122
[15] Han, J., Wu, K., 2022. Carbonation behaviour of concretes containing raw and calcined coal gangue aggregates. Journal of Building Engineering 47, 103916. https://doi.org/10.1016/j.jobe.2021.103916
[16] Han, J., Zhou, Y., 2017. Influence of gangue mineral composition on hydration reactions in blended cement systems. Construction and Building Materials 134, 452–460. https://doi.org/10.1016/j.conbuildmat.2016.12.163
[17] Hu, C., Zhang, J., 2021. Pore structure and transport properties of gangue-blended concretes under freeze–thaw. Cold Regions Science and Technology 186, 103298. https://doi.org/10.1016/j.coldregions.2021.103298
[18] Ji, X., Zhang, R., 2020. Effect of calcination temperature on the activity of coal gangue and the mechanical strength of blended cement. Journal of Materials Research and Technology 9 (6), 14121–14131. https://doi.org/10.1016/j.jmrt.2020.09.027
[19] Kumar, S., Singh, R., 2016. Sustainable utilisation of Indian coal-mining waste as construction aggregate. Resources, Conservation and Recycling 112, 36–46. https://doi.org/10.1016/j.resconrec.2016.04.011
[20] Li, H., Zhang, Y., 2012. Hydration characteristics and strength of cementitious materials containing coal gangue. Cement and Concrete Research 42 (8), 1079–1086. https://doi.org/10.1016/j.cemconres.2012.04.006
[21] Li, H., Zhao, Q., 2020. Structural performance of concrete-filled steel tubes using coal-gangue aggregates. Engineering Structures 222, 111108. https://doi.org/10.1016/j.engstruct.2020.111108
[22] Li, M., Zhou, Y., 2020. Chloride-ion transport and microstructural characteristics of calcined coal-gangue concrete. Construction and Building Materials 257, 119480. https://doi.org/10.1016/j.conbuildmat.2020.119480
[2]Li, W., Zhang, J., Wang, P., 2019. Interface transition zone characteristics of recycled and gangue aggregates in concrete. Materials Characterization 155, 109835. https://doi.org/10.1016/j.matchar.2019.109835
[23] Li, Y., Chen, Z., 2023. Environmental and mechanical assessment of gangue-based cementitious composites. Materials Today Sustainability 22, 100312. https://doi.org/10.1016/j.mtsust.2023.100312
[24] Liu, Y., Chen, H., Yang, S., 2017. Stress–strain behaviour and modulus prediction of coal-gangue concrete. Construction and Building Materials 149, 348–356. https://doi.org/10.1016/j.conbuildmat.2017.05.130
[25] Ma, X., Liu, P., 2022. Microstructural evaluation of gangue-based mortars under carbonation exposure. Materials 15, 5342. https://doi.org/10.3390/ma15155342
[26] Meng, T., Zhou, Q., 2018. Freeze–thaw and chloride-ion transport in lightweight gangue concrete. Construction and Building Materials 184, 506–514. https://doi.org/10.1016/j.conbuildmat.2018.07.035
[27] Sun, X., Zhou, Y., 2020. Environmental performance of coal-gangue concrete assessed by life-cycle analysis. Journal of Cleaner Production 277, 123286. https://doi.org/10.1016/j.jclepro.2020.123286
[28] Tang, W., Han, J., 2019. Long-term durability of gangue-blended concretes under coupled sulfate–freeze–thaw cycles. Cement and Concrete Composites 103, 270–281. https://doi.org/10.1016/j.cemconcomp.2019.04.003
[32] Wu, C., Liu, R., 2024. Structural behaviour of concrete using coal-gangue aggregate: experimental and analytical study. Cement and Concrete Composites 150, 106287. https://doi.org/10.1016/j.cemconcomp.2024.106287
[34] Xie, J., Yu, P., 2018. Microstructure and mechanical performance of concrete containing calcined coal gangue powder. Construction and Building Materials 174, 524–532. https://doi.org/10.1016/j.conbuildmat.2018.04.024
[36] Yang, F., Zhou, Y., 2020. Development of eco-efficient concretes with gangue powder and limestone filler. Journal of Cleaner Production 274, 122897. https://doi.org/10.1016/j.jclepro.2020.122897
[37] Yu, L., Han, J., 2021. Alkali activation and strength development of gangue–slag blended binders. Cement and Concrete Composites 124, 104233. https://doi.org/10.1016/j.cemconcomp.2021.104233
[38] Zeng, X., Wang, D., 2019. Hydration heat and microstructure of blended cements with coal gangue. Journal of Thermal Analysis and Calorimetry 138, 1129–1142. https://doi.org/10.1007/s10973-019-08118-8
[39] Zhang, J., Li, M., Zhou, Q., 2019. Freeze–thaw performance and pore-structure evolution of coal-gangue concrete. Construction and Building Materials 214, 180–190. https://doi.org/10.1016/j.conbuildmat.2019.04.091
[40] Zhang, X., Li, Z., Chen, W., 2023. Utilisation of calcined coal gangue as SCM: mechanical properties and microstructural characterisation. Cement and Concrete Research 168, 107194. https://doi.org/10.1016/j.cemconres.2023.107194
[41] Zhang, Y., Liu, J., 2025. Ductility enhancement of gangue-based concrete under confinement. Journal of Building Engineering 82, 108564. https://doi.org/10.1016/j.jobe.2025.108564
[42] Zhao, P., Li, W., 2022. Comparative microstructure and hydration mechanisms of fly ash and gangue blended concretes. Materials Characterization 191, 112135. https://doi.org/10.1016/j.matchar.2022.112135
[43] Zheng, L., Gao, Y., 2018. Compressive and tensile strength of concrete incorporating waste coal gangue powder. Construction and Building Materials 191, 501–510. https://doi.org/10.1016/j.conbuildmat.2018.09.021
[44] Zhou, Q., Han, J., 2023. Coupled chloride–carbonation durability of gangue–fly-ash blended concretes. Cement and Concrete Composites 145, 105229. https://doi.org/10.1016/j.cemconcomp.2023.105229
[45] Zhu, K., Zhao, Y., 2020. Influence of curing temperature on pozzolanic activity of coal gangue. Materials Today Communications 25, 101650. https://doi.org/10.1016/j.mtcomm.2020.101650
[46] International Energy Agency (IEA), 2023. The Role of Industrial Waste in a Just Transition. Paris, France. Available at: https://www.iea.org/
[47] United Nations Environment Programme (UNEP), 2024. Circular Economy and the Building Sector: Policy Roadmap. Nairobi, Kenya. Available at: https://www.unep.org/
Saleh, S. S., Abdu, R., & Suleiman, M. M. (2026). Effect of Entrepreneurship Education and Attitude on Entrepreneurial Intention Among Graduating Students of Polytechnics in Kano State, Nigeria. International Journal of Research, 13(1), 133–146. https://doi.org/10.26643/eduindex/ijr/2026/8
1Safiyanu Sulaiman Saleh, 2Rabiu Abdu, & 3Muhammad Muhammad Suleiman
1Department of Business Administration and Management,
1School Social & Management Sciences
2Bursary Department
3Department of Computer Science, School of Science & Technology
1,2,3Federal Polytechnic Kabo, Kano, Nigeria
ABSTRACT
This study explores the effects of Entrepreneurship Education (EE) and Entrepreneurial Attitude (EA) on Entrepreneurial Intention (EI) among Polytechnic’s in Kano State. Against the backdrop of Nigeria’s persistent youth unemployment and underemployment, the study seeks to determine whether exposure to entrepreneurship education and the development of a positive entrepreneurial mindset could influence students’ willingness to pursue self-employment. A thorough literature review and empirical evaluation established that entrepreneurship plays a vital role in economic transformation, especially in developing nations. Numerous studies reported a positive and significant link between EE, EA, and EI, some argue that the impact of EE is context-dependent and may be weakened by poor delivery or lack of practical engagement. The empirical literatures confirmed that EE tends to stimulate EI when it promotes self-efficacy, risk-taking, and innovation, and when coupled with a supportive entrepreneurial attitude. However, gaps remain in understanding these relationships in local contexts like Nigerian polytechnics. The study will adopt a quantitative research design and rely on data of the students obtained from the MIS Unit of Kano State Polytechnic, which recorded an HND graduating student population of 1,045 across 32 departments/programmes in various units/schools of the polytechnicAsample size of 285will be selected using theKrejcie and Morgan (1970). Astratified random sampling technique will ensure that all departments are proportionately represented. Data analysis will be conducted using SPSS version 26, applying descriptive statistics, Pearson’s correlation, and multiple regression analysis. The results is expected to reveal a statistically significant and positive relationship between EE and EI, as well as between EA and EI.
Entrepreneurship plays a vital role in fostering economic transformation, inclusive growth, and national development across the globe (Johnson, Adeoye, & Chen, 2023; Ferreira, Silva, & Martins, 2022; Okafor, Ezenwa, & Oyetunji, 2021). This is especially true for developing countries like Nigeria, where challenges such as poverty and high unemployment remain critical (Emeka, Agho, & Udeh, 2023; Asuquo, 2024; Idowu, 2023; Aina & Oladipo, 2021). Despite its abundance of human and material resources, Nigeria has struggled to achieve widespread economic prosperity. Most citizens still live below the poverty line, surviving on less than a dollar per day even after over sixty years of independence (Yakubu, Hassan & Omeje, 2022), while unemployment figures continue to rise (Bello, Danjuma, & Suleiman, 2023). A country with a vibrant entrepreneurial base has the potential to become economically stable and prosperous (Nasir, Lukman, Adisa, & Olaniyan, 2023). For young people, unemployment remains a particularly severe issue often double or triple the national average (Popescu & Dinu, 2023).
Entrepreneurship is not accidental – it is an intentional decision shaped by personal, educational, and environmental factors. Numerous studies have shown that entrepreneurial intention (EI) is influenced by aspects such as education, social and family background, and exposure to entrepreneurial education (EE) (Okon & Bello, 2022). This disconnect has fueled academic interest in entrepreneurship as a practical and desirable career path for students. As a result, many studies have examined EI and its antecedents to understand entrepreneurial behavior more deeply (Silva, Pereira, & Oliveira, 2022). Research has shown that African youth are particularly entrepreneurial, demonstrating a readiness to innovate and take risks (Adeniyi, Rashid, & Gamede, 2024). Entrepreneurial intention remains a key indicator for understanding how and why individuals initiate and develop new business ventures (Patel, Sharma, & Bhatnagar, 2021).In line with this, Petrova, Kuznetsova, & Romanova (2023) emphasized the importance of exploring more psychological and environmental variables that influence EI.
Similarly, Nor, Idris, Fatah & Salim (2022) recommended larger sample sizes and broader institutional representation in EI research. Okeke, Nwankwo & Ubah (2023), who examined EI in Muslim-majority regions, advised future research to expand its geographic and cultural scope while also including new influencing variables. Likewise, Khan, Yusuf, Ali, Sharma & Adeel (2021) noted that limited empirical work has been done in developing countries to fully understand the link between EE and EI. Despite the growing significance of EI in policy and practice, few empirical studies have focused on this topic within the Nigerian context. It is against this backdrop, the present study aims to address several of these issues. Specifically, it will investigate the effects of entrepreneurial education and students’ attitudes on entrepreneurial intention among graduating students in Kano State polytechnic.
1.1 PROBLEMS STATEMENT
Despite Nigeria’s abundant human and material resources, the country continues to experience high levels of youth unemployment and poverty. Polytechnic graduates, in particular, face significant challenges in securing employment within their field of study. This disconnect between formal education and economic opportunities has sparked growing concern about the effectiveness of Nigeria’s higher education system in fostering entrepreneurship. While entrepreneurship education (EE) is increasingly recognized as a catalyst for equipping students with the mindset and skills necessary for self-employment, many Nigerian polytechnic still predominantly train students to become employees rather than entrepreneurs. Furthermore, although entrepreneurial intention (EI) is widely acknowledged as a precursor to actual entrepreneurial behavior, empirical studies examining the specific influence of EE and student attitudes on EI remain limited within the Nigerian context. The absence of localized evidence restricts policymakers, educators, and curriculum developers from making informed decisions to bridge the education-employment gap.
This study is crucial because it seeks to address the urgent challenge of youth unemployment in Nigeria by examining the role of entrepreneurial education and student attitudes in shaping entrepreneurial intentions. Previous research conducted in developed countries has demonstrated a positive relationship between EE and EI; however, such findings cannot be directly applied to Nigeria without context-specific investigation. Additionally, scholars have called for expanded research into the psychological and educational factors influencing EI, especially in developing countries. This study not only responds to that call but also contributes to filling a significant empirical gap by focusing on Kano State Polytechnic students at a critical transition point graduation. By identifying the variables that significantly impact EI, the findings of this study will inform educational policies, polytechnic curricula, and entrepreneurial development programs aimed at transforming graduates from job seekers to job creators. Ultimately, the study supports the national goal of promoting economic self-reliance and sustainable development through youth entrepreneurship.
1.2 Objectives of the Study
The primary objective of this study is to examine the effect of entrepreneurship education and students’ attitudes on entrepreneurial intention among HND graduating students of Kano State polytechnic. To achieve this main goal, the study seeks to:
Assess the impact of entrepreneurship education (EE) on the entrepreneurial intention (EI) of HND graduating students of Kano State Polytechnic.
Examine the influence of students’ attitudes towards entrepreneurship on their intention to become entrepreneurs.
Determine the combined effect of entrepreneurship education and attitude on entrepreneurial intention among Kano State Polytechnic HND graduates.
1.3 Hypotheses Development
Based on the above objectives, the study postulated the hypotheses: –
HO1: There is no significant positive relationship between entrepreneurship education and entrepreneurial intention of HND graduating students of Kano State Polytechnic
HO2: There is no significant positive relationship between students’ attitude and entrepreneurial intention of HND graduating students of Kano State Polytechnic
HO3: There is no significant positive relationship between combination of EE & EA and EI of HND graduating students of Kano State Polytechnic
LITERATURE REVIEW/CONCEPTUAL DEFINITIONS
2.1 Entrepreneurial Intention
Entrepreneurial intention (EI) has emerged as a central concept in entrepreneurship research and is widely recognized as a strong predictor of planned, purposeful entrepreneurial behavior (Salim, Farouk & Nor, 2021; Adegbite, Yusuf & Lawani, 2023; Chukwuma, Bello & Hassan, 2022). EI reflects an individual’s conscious decision and commitment to start a new business or engage in entrepreneurial activities in the future. It signifies a deliberate mindset that precedes action, driven by the identification of opportunities and the perceived feasibility of launching a venture (Rahman, Tan & Othman, 2022). Furthermore, EI is often influenced by one’s ability to analyze the environment, assess market gaps, and creatively propose solutions through business ideas. This self-awareness and contextual understanding are what enable individuals, particularly students, to discover and refine entrepreneurial opportunities (Oyelola, Bakare & Adebayo, 2021). Supporting this, Martins, Lima, & Correia (2022) argue that EI represents a goal-oriented mindset, allowing individuals to align their personal and professional aspirations with the dynamic demands of entrepreneurship.
In summary, entrepreneurial intention is a multidimensional concept encompassing the desire, determination, and strategic planning to engage in entrepreneurial activities. It represents a foundational construct for understanding entrepreneurial behavior and is a critical area of interest for scholars, educators, and policymakers seeking to enhance entrepreneurship development, particularly among youth and polytechnic students.
2.2 Entrepreneurship Education and Entrepreneurial Intention
In recent years, there has been a noticeable increase in the institutionalization of entrepreneurshipeducation (EE) within higher education curricula across disciplines. It is now common for students in fields such as the arts, engineering, and sciences to be exposed to formal entrepreneurship training at the Polytechnics level (Chinelo, Abbas & Wang, 2022). This shift reflects a growing consensus on the value of EE in broadening students’ skillsets, encouraging self-reliance, and equipping them with practical knowledge to navigate the uncertainties of post-graduation life (Ibrahim, Musa & Zhang, 2023). Numerous studies have confirmed that EE has a significant and positive impact on entrepreneurial intention (EI), which refers to an individual’s conscious decision to pursue entrepreneurship as a career path (Ayoade, Kwame, & Zhou, 2021). As such, many governments and educational institutions have integrated entrepreneurship into academic policy, not only to combat youth unemployment but also to stimulate innovation, productivity, and inclusive economic growth (Olowolaju, Shah, & Ridwan, 2023). EE serves as a strategic tool to ignite students’ interest in start-ups, wealth creation, and self-employment (Chen, Adebayo & Tan, 2021).
The integration of EE into polytechnic programs is intended to instill fundamental entrepreneurial competencies that guide students toward business ownership and sustainability. As noted by Abdulaziz, Fatai, Munirat, Ifeoma, & Raymond (2023), EE empowers students to acquire essential entrepreneurial knowledge—planning, decision-making, opportunity recognition, risk-taking which supports business creation and strategic management. Beyond technical knowledge, EE fosters creativity, responsibility, and an entrepreneurial mindset, transforming passive learners into active problem-solvers and future business leaders (Nwachukwu, Gomez & Xu, 2022). Empirical research continues to demonstrate a strong theoretical and practical link between EE and EI. Multiple studies have shown that students exposed to structured EE programs exhibit higher entrepreneurial intentions compared to their counterparts without such exposure (Okonjo, Felix, & Wang, 2024; Rahim, Ishola, & Le, 2023). Similarly, researchers such as Fatima, Bello, and Wahab (2022), and Noor, Idris, & Hassan (2021), have found that EE plays a crucial role in shaping students’ attitudes, confidence, and motivation toward entrepreneurship.
2.3 Entrepreneurial Attitude and Entrepreneurial Intention
Entrepreneurial education (EE) plays a significant role in shaping students’ entrepreneurial attitudes (EA), especially among those enrolled in business-related and economics programs (Okeke, Yusuf & Bello, 2021). Entrepreneurial attitude refers to an individual’s evaluative disposition – either positive or negative towards entrepreneurship, and it includes cognitive, emotional, and behavioral tendencies (Abdullahi, Musa & Li, 2022). When students develop favorable entrepreneurial attitudes, they are more likely to express interest in entrepreneurial ventures. In this context, attitude serves as a psychological framework that shapes how individuals perceive entrepreneurship and whether they are inclined to engage in it (Ogunyemi, Raji & Zhang, 2022). Attitude influences behavior, as it is linked to how one processes and reacts to information, events, or opportunities. This notion is echoed by Bello, Chukwudi, & Wang (2021), who suggest that entrepreneurial behavior is rooted in how an individual cognitively and emotionally responds to business opportunities and risks.
Scholars have emphasized that entrepreneurial action is an outcome of both attitude and intention. In essence, before entrepreneurship becomes an action, it begins as a mindset shaped by positive perceptions and internal motivation (Saidu, Ibrahim, & Chen, 2023). Therefore, cultivating positive attitudes is crucial in promoting entrepreneurial aspirations among students. Entrepreneurial attitude reflects how welcoming, enthusiastic, or critical students are toward the idea of starting a business. Pulido, Azubuike, & Zhou, (2024) define EA as a predisposition toward entrepreneurship based on self-perceptions of achievement, creativity, personal autonomy, and self-esteem. However, some scholars argue that the relationship is not always linear. For example, Ogundele, Taiwo, & Chen (2021) found that while EE improves EA, other factors such as perceived behavioral control and external support systems are also crucial in translating attitudes into intention. In a broader study, Liang, Adesina, & Wang (2024) noted that even when students have positive attitudes toward entrepreneurship, structural barriers such as lack of funding, mentorship, or market access can reduce their likelihood of acting on those intentions.
2.4 Review of Related Empirical Literature
The relationship between entrepreneurial attitude (EA)andentrepreneurial intention (EI) has attracted significant scholarly attention over the years, particularly due to its centrality in understanding entrepreneurial behavior. Empirical studies across different contexts and time periods consistently show that EA is a strong predictor of EI, though the strength and direction of this relationship may vary depending on cultural, educational, and institutional variables. A seminal work by Krueger, Reilly, & Carsrud (2000) using the Theory of Planned Behavior (TPB) laid the groundwork for understanding intention as a function of attitude, perceived behavioral control, and subjective norms. Their study confirmed that individuals with a positive disposition toward entrepreneurship are more likely to form intentions to start a business. Building on this, Liñán & Chen (2009) conducted a cross-cultural study and found that students with favorable attitudes toward entrepreneurship had higher EI scores across multiple countries, confirming the universality of the attitude-intention relationship. Similarly, Fayolle & Gailly (2015) examined European students and discovered that positive attitudes toward innovation, self-efficacy, and achievement were strongly correlated with entrepreneurial career aspirations.
Recent empirical studies between 2021 and 2024continue to affirm these earlier findings while offering updated insights. For example, Adeoye, Ladan, & Jiang (2023) investigated Nigerian undergraduates and revealed that entrepreneurial attitude defined by indicators such as personal control, risk tolerance, and creativity significantly predicted students’ entrepreneurial intentions. The study emphasized that EA was not only influenced by personality traits but also shaped by exposure to entrepreneurship education. Okon, Bello, & Wang (2022) examined students in both Nigerian and Chinese polytechnics, and their comparative study revealed that entrepreneurial attitude mediated the impact of entrepreneurial education on EI. Their findings suggest that positive cognitive and emotional evaluations of entrepreneurship, developed through polytechnic curricula and role models, enhance students’ willingness to engage in start-up ventures. In Malaysia, Nasir, Okechukwu, & Fu (2021) conducted a structural equation modeling analysis among business students and found a direct, significant relationship between EA and EI. The study also found that entrepreneurial attitude was strengthened by factors such as internship experiences, student enterprise programs, and perceived entrepreneurial climate on campus. Additionally, Pulido, Azubuike, & Zhou (2024) carried out a longitudinal study in Nigeria that tracked students from their second year through graduation. The study showed that those who participated in project-based entrepreneurship modules developed stronger entrepreneurial attitudes and were three times more likely to express the intention to start their own businesses.
Other studies, such as those by Adamu, Olatunji, & Ye (2023), observed that EA plays a moderating role between entrepreneurship education and EI. While most students showed high levels of enthusiasm for entrepreneurship, the absence of practical application and institutional support led to a gap between intention and action. Similarly, Ogundele, Taiwo, & Chen (2021) reported that although positive entrepreneurial attitudes were prevalent among Nigerian polytechnic students, other factors such as fear of failure, lack of capital, and insufficient mentoring significantly weakened the effect on actual intention. A broader international perspective was presented by Liang, Adesina, & Wang (2024), who explored gender differences in EA and EI across three countries. Their findings indicated that while male students generally displayed higher entrepreneurial attitudes, female students’ EI was significantly influenced by social encouragement and community-based entrepreneurial programs.
Earlier works have also echoed these findings. For instance, Kusmintarti, Thoyib, Ashar, & Maskie (2014) identified that students with strong EA measured by achievement motivation and innovativeness were more inclined to start businesses. Pulka, Aminu, & Rikwentishe (2015) found similar results in a Nigerian context, where EA mediated the relationship between entrepreneurial education and EI. Studies such as Ismail (2015)andRuswanti (2015)emphasized the psychological dimensions of EA, arguing that how individuals emotionally and cognitively relate to entrepreneurship plays a major role in intention formation. Abun, Foronda, & Agoot (2018) found in the Philippines that EA significantly predicted the entrepreneurial intentions of polytechnic students, especially when paired with practical business experiences. Moreover, studies like those by Hassan, Norashikin, & Omar (2016) and Trang & Mintardjo (2018) also confirmed that EA not only predicts EI but can also be enhanced through entrepreneurship education, mentorship, and experiential learning opportunities.
The empirical literature spanning more than two decades strongly supports the assertion that entrepreneurial attitude is a key antecedent of entrepreneurial intention. While the strength of this relationship is generally positive and significant, the impact of attitude on intention can be enhanced or diminished depending on a range of contextual and moderating factors, including exposure to entrepreneurship education, access to resources, institutional support, and socio-cultural influences.
2.5 Research Model
Entrepreneurship Education (EE)
Entrepreneurial Intention (EI)
Entrepreneurial Attitude (EA)
Fig 1: Author’s Model, 2025
The research model investigates the influence of Entrepreneurship Education (EE) and Entrepreneurial Attitude (EA) on Entrepreneurial Intention (EI) among HND graduating polytechnic students in Kano State Polytechnic. It proposes that EE directly enhances students’ intentions to become entrepreneurs by equipping them with relevant knowledge, skills, and experiences. At the same time, EE is believed to shape students’ attitudes toward entrepreneurship, such as their confidence, motivation, and risk tolerance, which in turn influence their intention to start a business. Overall, the model is used to explore how exposure to entrepreneurship education and the development of a positive entrepreneurial mindset together drive students’ willingness to engage in entrepreneurial activities after graduation.
METHODOLOGY
This study will adopt a quantitative research design, aimed at assessing the effects of entrepreneurship educationandentrepreneurial attitudeonentrepreneurial intention among HND graduating students of Kano State Polytechnic. The design is non-experimental and analytical, utilizing structured data to evaluate relationships among variables. The target population will comprise all HND graduating students of 2025 from32 departments/programmes, with a total of 1,045 students as documented by the institution’s Management Information System (MIS) Unit. To determine the appropriate sample size, the Krejcie and Morgan (1970) table will be used, yielding a representative sample of 285 respondents. A stratified random sampling technique will be employed, with each department to be treated as a stratum.
4.0 RESULTS
4.1 Reliability
Education
Reliability Statistics
Cronbach’s Alpha
No. of Items
.835
8
Attitude
Reliability Statistics
Cronbach’s Alpha
No. of Items
.807
8
Intention
Reliability Statistics
Cronbach’s Alpha
No. of Items
.790
8
The interpretation of reliability using Cronbach’s Alpha was based on the rule of thumb provided by (Sekaran & Bougie, 2010), who suggest that the Cronbach Alpha should be at least .70 or more. From the above analysis, the composite reliability coefficients of the latent constructs ranged from .790 to .835, with each exceeding the minimum acceptable level of .70, suggesting adequate internal consistency reliability of the measures used in this study (Hair, Ringle, & Sarstedt, 2011).
4.2 Regression
Model Summaryb
Model
R
R Square
Adjusted R Square
Std. Error of the Estimate
Change Statistics
R Square Change
F Change
df1
df2
Sig. F Change
1
.580a
.336
.331
4.01613
.336
68.775
2
272
.000
a. Predictors: (Constant), ATTITUDE, EDUCATION
b. Dependent Variable: INTENTION
ANOVAa
Model
Sum of Squares
df
Mean Square
F
Sig.
1
Regression
2218.584
2
1109.292
68.775
.000b
Residual
4387.176
272
16.129
Total
6605.760
274
a. Dependent Variable: INTENTION
b. Predictors: (Constant), ATTITUDE, EDUCATION
Coefficientsa
Model
Unstandardized Coefficients
Standardized Coefficients
T
Sig.
Collinearity Statistics
B
Std. Error
Beta
Tolerance
VIF
1
(Constant)
12.761
1.540
8.286
.000
Education
.139
.060
.153
2.306
.022
.555
1.803
Attitude
.448
.064
.466
7.025
.000
.555
1.803
a. Dependent Variable: INTENTION
The results suggest that both Entrepreneurial Education and Entrepreneurial Attitude significantly predict Entrepreneurial Intention among graduating students of Kano State Polytechnic. The regression model confirms that both variables (EE & EA) individually and jointly contribute significantly to predicting EI. These findings support prior studies and reinforced the importance of integrating entrepreneurship education across all departments to foster self-employment mindsets in students.
4.3 Correlations
EDUCATION
ATTITUDE
INTENTION
EDUCATION
Pearson Correlation
1
Sig. (2-tailed)
N
275
ATTITUDE
Pearson Correlation
.667**
1
Sig. (2-tailed)
.000
N
275
275
INTENTION
Pearson Correlation
.464**
.568**
1
Sig. (2-tailed)
.000
.000
N
275
275
275
**Correlation is significant at the 0.01 level (2-tailed).
The results suggest that both Entrepreneurial Education and Entrepreneurial Attitude significantly predict Entrepreneurial Intention among graduating students of Kano State Polytechnic. The positive correlations indicate that higher exposure to entrepreneurship education and a favorable attitude toward entrepreneurship are associated with stronger intentions to engage in entrepreneurial ventures.
CONCLUSION
In conclusion, entrepreneurship education plays a pivotal role in shaping students’ entrepreneurial mindset, skills, and intentions. While there is strong evidence supporting its positive influence on EI, the effectiveness of EE is highly dependent on content quality, pedagogical approach, and contextual relevance. Thus, there is a continuing need to strengthen EE curricula in polytechnics, tailor them to local entrepreneurial ecosystems, and embed experiential learning elements to foster genuine entrepreneurial intentions among students. This growing body of evidence has prompted scholars and educators to view EE as a foundation for building entrepreneurial ecosystems within academic institutions. Entrepreneurial attitude is a critical psychological construct that significantly influences entrepreneurial intention. Fostering positive entrepreneurial attitudes through education, experiential learning, and supportive ecosystems is essential to nurturing a generation of proactive, innovation-driven graduates.
RECOMMENDATIONS
Based on the findings above, the following recommendations were developed –
Curriculum redesign – this is to ensure transition from more of theoretical lectures to practical based learning such as business simulations, business incubation, and venture creations after practical, where students earn credit for launching actual startups
Attitude shaping – since attitude is a major predictor, teachers should focus on social persuasion to shape the students’ psychological attitude
Dream building – invite young successful alumni entrepreneurs to speak to students. This will boost their ambition and reduce fear of failure and makes them feel that it is a feasible career
Encourage arts, science and engineering students to take entrepreneurship modules together. Innovation often happens at the intersection of diverse skill sets
Policy makers to encourage startup development by giving grants instead of loans.
Government to intensify “ease of doing business” to facilitate development of business ideas to reality
Future researches to focus more in ways of translating academic research into practice.
REFERENCES
Abdulaziz, A., Fatai, A., Munirat, M., Ifeoma, E., & Raymond, D. (2023). Empowering youth through entrepreneurship education in Nigerian polytechnics. International Journal of Entrepreneurial Development, 28(3), 115–130.
Abdullahi, B., Musa, S., & Li, Q. (2022). Entrepreneurial attitude as a determinant of entrepreneurial intention among undergraduates. Journal of Entrepreneurship Studies, 34(2), 88–101.
Abun, D., Foronda, D., Agoot, F., Belandres, M., & Magallanez, J. (2018). Attitude and intention towards entrepreneurship among higher education students in the Philippines. Journal of Entrepreneurship Education, 21(2), 1–14.
Adamu, R., Olatunji, K., & Ye, Y. (2023). Bridging the gap between entrepreneurial attitude and intention through experiential learning. African Journal of Business and Management, 29(4), 242–259.
Adegbite, S. A., Yusuf, A. J., & Lawani, A. O. (2023). Attitude and entrepreneurial intent: Mediating role of entrepreneurship education and pedagogies. Covenant Journal of Entrepreneurship, 7(2), 1-14.
Adeniyi, A. O., Rashid, L. A., & Gamede, V. (2024). Individual entrepreneurial orientation for entrepreneurial readiness: A study of vocational students in Nigeria. Humanities and Social Sciences Communications, 11(1), 1-10. https://doi.org/10.1057/s41599-024-02728-9
Adeoye, T., Ladan, A., & Jiang, Z. (2023). Influence of entrepreneurial attitude on the formation of entrepreneurial intention among Nigerian students. International Journal of Management and Entrepreneurship, 17(1), 33–50.
Aina, A., & Oladipo, R. (2021). Challenges of youth entrepreneurship in Nigeria. Journal of Sustainable Development, 10(2), 87–101.
Asuquo, R. E. (2024). Entrepreneurship education as a response to graduate unemployment in
Nigeria. Journal of African Education and Innovation, 6(1), 100–115.
Ayoade, A., Kwame, E., & Zhou, L. (2021). Impact of entrepreneurship education on entrepreneurial career choice. Education and Entrepreneurship Quarterly, 5(3), 44–61.
Bello, J., Chukwudi, A., & Wang, H. (2021). Cognitive and emotional dimensions of entrepreneurial behavior among undergraduates. Entrepreneurship and Society Review, 9(2), 44–62.
Bello, K. S., Danjuma, I., & Suleiman, A. (2023). Effect of entrepreneurship on economy growth and development in Nigeria. Journal of Human Resources and management Science, 2(2), 108-124. https://hummingbirdjournals.com/hrms/article/view/108
Chen, X., Adebayo, R., & Tan, H. (2021). Entrepreneurship education and youth employability in Sub-Saharan Africa. Journal of Youth and Entrepreneurship, 10(1), 15–31.
Chinelo, A., Abbas, M., & Wang, X. (2022). Integration of entrepreneurship into non-business programs in Nigerian tertiary institutions. African Journal of Educational Research, 22(3), 77–91.
Chukwuma, J., Bello, A., & Hassan, M. (2022). Investigating predictors of entrepreneurial intention among Nigerian youth. Entrepreneurship Development Studies, 7(4), 198–212.
Emeka, C., Agho, S., & Udeh, M. (2023). Re-thinking poverty eradication through education and entrepreneurship. African Economic Review, 20(2), 91–107.
Fatima, S. K., Bello, A., & wahab, S. A. (2022). Entrepreneurial alertness and intention among university students: The moderating role of entrepreneurship education. International Journal of Business and Technopreneurship, 12(1)x, 45-58.
Fayolle, A., & Gailley, B. (2015). The impact of entrepreneurship education on entrepreneurial attitudes and intention: Hysteresis and persistence. Journal of Business Venturing, 30(1), 75-93. https://doi.org/10.1016/j.jbusvent.2014.07.001
Ferreira, L., Silva, J., & Martins, D. (2022). Youth entrepreneurship for sustainable national development. International Journal of Social Innovation, 17(3), 129–145.
Hair, J. F., Ringle, C. M., & Sarstedt, M. 92011). PLS-SEM: Indeed a silver bullet. Journal of Marketing Theory and Practice, 19(2), 139-152. https://doi.org/10.2753/MTP1069-6679190202
Ibrahim, A. M., Musa, I., & Zhang, Q. (2023). Digital media literacy and entrepreneurial intention: The mediating role of self-efficacy among university students. International Journal of Professional Business Review, 8(5), e01854. https://doi.org/10.266668/businessreview/2023.v815.1854
Idowu, T. (2023). Economic policies and youth entrepreneurship in Nigeria. Nigerian Journal of Public Administration, 19(1), 12–28.
Johnson, O., Adeoye, A., & Chen, Y. (2023). Human capital development and entrepreneurship for national progress. Global Journal of Human Resources and Development, 13(4), 154-171.
Khan, S. A. R., Yusuf, S., Ali, S. S., Sharma, A., & Adeel, S. (2021). Influence of financial literacy and educational skills on entrepreneurial intent: Empirical evidence from young entrepreneurs of Pakistan. Journal of Asian Finance, Economics and Business, 8(1), 697-710.https://doi.org/10.13106/jafeb.2021.vol8.no1.697
Krejcie, R. V., & Morgan, D. W. (1970). Determining sample size for research activities. Educational and Psychological Measurement, 30(3), 607–610.
Krueger, N. F., Reilly, M. D., & Carsrud, A. L. (2000). Competing models of entrepreneurial intentions. Journal of Business Venturing, 15(5-6), 411-432. https://doi.org/10.1016/S0883-9026(98)00033-0
Liang, J., Adesina, R., & Wang, Y. (2024). Gender differences in entrepreneurial intention across three countries. Entrepreneurship and Gender Studies, 8(1), 49–67.
Linan, F., & Chen, Y.-W. (2009). Development and cross-cultural application of a specific instrument to measure entrepreneurial intentions. Entrepreneurship Theory and Practice, 33(3), 593-617. https://doi.org/10.1111/j.1540-6520.2009.00318.x
Martins, J. M., Lima, T. M., & Correia, S. C. (2022). Entrepreneurial intention and the influence of personality traits: A study among university students. International Journal of Professional Business Review, 7(1), eo323.https://doi.org/10.266668/businessreview/2022.v7i1.323
Nasir, M., Okechukwu, P., & Fu, L. (2021). Student entrepreneurial attitudes and intentions: Evidence from Malaysian polytechnics. International Journal of Business and Management, 16(3), 50–63.
Nasir, A., Lukman, S., Adisa, W. B., & Olaniyan, S. O. (2023). Entrepreneurial orientation and performance of small and medium enterprises in Nigeria. The moderating role of institutional environment. International Journal of Research and Innovation in Social Science, 7(9), 1145-1162. https://doi.org/10.47772/,2023.7991
Noor, M. S. M., Idris, A., & Hassan, Z. (2021). Assessing the relationship between entrepreneurship education, entrepreneurial mindset and intention among university students. International Journal of Academic Research in Business and Social Sciences, 11(3), 854-869. https://doi.org/10.6007/IJARBSS/v11-i3/8975
Nor, M. M., Idris, A., Fatah, A. M., & Salim, N. (2022). The impact of human resource management practices on employee performance among government servants in Malaysia. International Journal of Academic Research in Business and Social Sciences, 12(10), 2584-2594. https://doi.org/10.46886/IJARBSS/v12-i10/12051
Nwachukwu, C., Gomez, J. M., & Xu, S. (2022). Entrepreneurial intention and startup preparation: A study among nosiness students. Journal of Business and Socio-Economic Development, 2(1), 1-15. https://doi.org/10.1108/JBSED-01-2022-0010
Ogunyemi, A. O., Raji, A. A., & Zhang, Q. (2022). The impact of entrepreneurship education on entrepreneurial intention: The mediating role entrepreneurial self-efficacy. International Journal of Research in Business and Social Sciences, 11(4), 112-121. https://doi.org/10.20525/ijrbs.v11i4.1812
Okafor, M., Ezen0wa, P., & Oyetunji, B. (2021). Entrepreneurial ecosystems and national development. Journal of Policy Research and Innovation, 14(4), 209–224.
Okeke, C. D., Yusuf, S. A., & Bello, M. B. (2021). Vocational skills acquisition and entrepreneurial intention among undergraduates in Nigeria. Journal of management and Social Sciences, 10(2), 442-456.
Okeke, M. N., Nwankwo, K. O., & Ubah, J. I. (2023). Environmental factors and entrepreneurial intentions of graduating students in Nigerian universities. International Journal of Business and Management Review, 11(4), 18-34.
Okon, E. E., & Bello, K. S. (2022). Financial innovation and the growth of emerging markets in Nigeria. Journal of management and Social Science Research, 3(1), 45-59.
Okon, J. E., Bello, A. S., & Wang, Y. (2022). Digital media and entrepreneurship intention among university students. Journal of Business and Economic Development, 7(2), 45-58.
Okonjo, N. P., Felix, A. O., & Wang, Y. (2024). Human capital development and social entrepreneurial intention: A comparative analysis of digital literacy among university students. Journal of Global Entrepreneurship Research, 14(1), 112-129. https://doi.org/10.1007/s40497-024-00381-w
Olowolaju, P. S., Shah, S. Z. A., & Ridwan, M. S. (2023). Determinants of entrepreneurial intention among university students: An empirical study. International Journal of Professional Business review, 8(6), e01942. https://doi.org/10.266668/business review/2023.v8i6.1942
Oyelola, B., Bakare, S., & Adebayo, K. (2021). Cognitive antecedents of entrepreneurial
intention among final-year students. Entrepreneurship and Development Review, 12(3),
89–106.
Patel, R., Sharma, S., & Bhatnagar, V. (2023). Digital entrepreneurship and financial inclusion: The role of FinTech in driving sustainable growth. Journal of Business and Economic Research, 21(4), 312-330. https:/doi.org/10.1016/j.busres.2023.10.015
Petronova, N. P., Kuznetsova, A. V., & Romanova, N. V. (2023). Assessment of digitalization of paid services and services of the regions of the Russian Federation based on a multipara metric data analysis. Journal of Applied Economic Research, 2(3), 542-566. https://doi.org/10.15826/vestnik.2023.22.3.024
Popescu, C. R. G., & Diu, M. S. (2023). The influence of economic and entrepreneurial education on perception and attitudes towards entrepreneurship. Sustainability, 15(20), 14793. https://doi.org/10.3390/su152o14793
Rahman, M. A., Tsn, S. L., & Othman, A. H. A. (2022). Influence of entrepreneurship education, self-efficacy, and university support on entrepreneurship intention. Journal of Business and management Studies, 4(2), 241-252. https://doi.org/10.32996/jbms.2022.4.2.19
Rahim, A. B., Ishola, S. A., & Le, T. H. (2023). Determinants of green entrepreneurial intention among university students: An application of planned behavior. Journal of Cleaner Production, 385(1), 135-150, https://doi.org/10.1016/j.jclepro.2022.135684
Pulka, B. M., Aminu, A. A., & Rikwentishe, R. 92015). The impact of entrepreneurship education on entrepreneurial intentions of university students in Nigeria. International Journal of Research in Business Studies and Management, 2(9), 1-11.
Pulido, M., Azubuike, E., & Zhou, Q. (2024). Entrepreneurial transformation in higher education:
A longitudinal study. Higher Education and Entrepreneurship Research, 9(1), 15–38.
Saidu, M., Ibrahim, G., & Chen, X. (2023). Psychological foundations of entrepreneurial intention in African universities. Journal of Contemporary Entrepreneurial Studies,
15(2), 74–89.
Salim, R., Farouk, A., & Nor, M. (2021). Exploring cognitive foundations of entrepreneurial intention. Global Business and Management Review, 11(1), 23–38
Sekaran, U., & Bougie, R. (2010). Research methods for business: A skill building approach (5th ed.). John Wiley & sons.
Silva, T. H., Pereira, Y. L., & Oliveira, L. B. (2023). Higher education’s influence on social networks and entrepreneurial intention. Journal of Entrepreneurship and Small Business, 15(3), 210-228.
Suleiman, M., Adamu, S., & Ibrahim, N. (2024). Entrepreneurial orientation among Nigerian undergraduates. International Journal of Business Studies, 28(1), 65–80.
Trang, I., & Mintardjo, C. M. (2018). The influence of entrepreneurship education on entrepreneurial intention through self-efficacy and motivation. International Journal of Applied Business and International Management, 3(2), 1-11. https://doi.org/10.32535/ijabim.v3i2.131
Walters, T., Onuoha, M., & Makinde, F. (2023). Harnessing youth for sustainable development in West Africa. Journal of Youth Policy & Innovation, 17(2), 39–54.
Yakubu, H., Hassan, M., & Omeje, T. (2022). Poverty and entrepreneurship in Nigeria: A
paradox? Nigerian Journal of Economic Reforms, 13(3), 44–60.
Odiaka, E. E. (2026). The Diversity and Abundance of Soil Microorganisms within Three Snail Farm Locations. International Journal of Research, 13(1), 123–132. https://doi.org/10.26643/eduindex/ijr/2026/7
The study was undertaken to determine the diversity and abudance of soil microorganism within three snail farm locations designated a location L1, L2 and L3. Bacterial and Fungal isolates were identified by their cultural and morphological characteristics using established characters and the counts were determined using standard spread plate technique. Snail species reared on the farm were the giant African land snail. A total of 12 species of bacteria and 10 species of fungi were recorded at the three locations within the farm. The bacteria species were widely distributed. The highest number of bacteria was recorded in location L1 while the highest number of fungi species were recorded in L1 and L2. Bacillus was the most dominant bacteria species with the highest Relative Abundance recorded during the study while Aspergillus was the most dominant fungi species. Bacteria and fungi were typical of an environment with specie richness.
Bacteria make up the most abundant organism in the soil. Soil fungi may occur as free-living mycorrhizal association with plant roots. High concentration of microrganisms can occur from animal husbandry operations and this can result in health hazards due to the presence of pathogens (Obasohan et al, 2010).
Climate and its effect on soil have an associated effect on snail farming. The effect of heat resulting in high soil temperature could lead to reduced feed intake, reduced body weight, poor hatchability and fertility (Afolabi, 2013). Snail farm soil is generally a favorable habitat for the proliferation of microorganisms with micro colonies developing around soil particles. The objectives of the study are to determine the microbial dynamics of the snail farm soil interms of their diversity and abundance.
MATERIALS AND METHODS
The Study Site
The study area is situated in Federal University of Akure south gate in Ondo state of Nigeria. Ondo state lies on latitude 05.0 41’N and longitude 06 .32’E. The area lies within the tropical rainforest belt. The dry season usually occurs between October and March while the raining season starts from April to October.
EXPERIMENTAL PROCEDURE
Samples of the snail farm top soil were collected from three locations and their replicates in the farm. The samples were labelled according to the site of collection as E1, E2, E3. F1, F2, F3 and G1, G2, G3. The samples collected were top soils (8.5 cm dept) using an auger 8.5 cm diameter. The soil samples were introduced into plastic containers for laboratory analysis.
Soil parameters determined were soil PH, soil organic matter content, soil temperature and soil microbial load. The soil samples were transported in polyethylene bags to the laboratory for analysis.
The soil samples from the 3 locations were analyzed for bacteria and fungi population using standard spread-plate dilution method by Seely and Vandemark (1981). For bacteria isolation, incubation was done for 5days, a nutrient agar containing 0.015% (w/v) nystatin (to inhibit fungi growth) was used. While potatoe dextrose agar to which 0.05% (w/v) chloramphenicol was used for fungal isolation and incubation for 7 days.
Sterilization techniques
The polyethylene bags were cold-sterilized in uv-radiation box for at least 12 h (usually overnight), while glassware was treated in the hot-air oven at 1600 C for 2 h. Growth media and diluents (distilled water) were autoclaved at 1210 C for 15 min.
Determination of the total microbial load/total viable count of the sample using standard plate count method
Microbiological analyses
The soil sample was mixed, and a suspension of 1 g (dry weight equivalent) in 10 ml of sterile water was prepared. One ml of the soil suspension was then diluted serially (ten-fold) and used in the estimation of aerobic heterotrophic bacterial and fungal populations by standard spread-plate dilution method described by Seeley and VanDemark (1981), in triplicate. Nutrient agar containing 0.015%(w/v) nystatin (to inhibit fungi growth) was used for bacteria isolation and incubation was at 35oC for five days. Potato dextrose agar to which 0.05% (w/v) chloramphenicol has been added (to inhibit bacteria growth) was used for fungal isolation, and incubation was at ambient temperature for seven days.
Identification of Isolates
Identification of isolates for the experiment was based on cultural, microscopic and biochemical characteristics with reference to Bergey,s manual on determinative bacteriology (1989) for bacteria and Fawole and Osho (2001) for fungi characterization and identification.
Soil PH
Soil PH was determined according to the procedure described by Ujowundu, et al (2011)
Statistical Analysis
All data collected were analysed statistically using one–way Analysis of Variance (ANOVA) using SPSS 15.0. The significance difference among mean was determined by the use of Duncan,s Multiple Range Test (Duncan, 1995)
The statistical model is as follows:
Where yij = overall observation of the effect of the bambara nut offal (A) and enzyme (B) on the ith and jth individual
μ = population mean
Ti = effect of bambara nut offal level on the ith individual
Bj = effect on the jth individual
= random error
RESULTS AND DISCUSSION
RESULTS
In Table 1, the highest number of bacteria was recorded in location L1 (41). Sizeable number of bacteria species were recorded in the three locations with the location L3(Control) having the lowest number. Bacillus was the most abundant species and the least abundant specie was Alcaligens.
Table 1: Bacteria abundance recorded in the three locations n x 103 (CFU/g)
BACTERIA L1 L2 L3 TOTAL
Pseudomonas 5 3 17 25
Xantomonas 2 2 2 6
Bacillus 9 9 4 28
Proteus 4 3 – 7
Chromobacterium 4 2 1 7
Staphylococcus 5 2 4 11
Vibrio 1 2 – 3
Clostridium 2 2 2 6
Erwinia 1 2 1 4
Klebsiela 2 3 – 5
Alcaligens 2 – – 2
Clavibacter 1 2 2 5
Total 41 35 33 109
Number of species 12 11 8 12
Table 2 show Pseudomonas as the specie with the highest relative abundance during the study. Bacillus are the second most abundant species recorded. Alcaligens have the lowest relative abundance.
Table 2: Relative abundance of some bacteria species found in the snail farm
BACTERIA L1 L2 L3 MEAN
Pseudomonas 12.19 8.57 51.51 24.09
Xantomonas 4.87 5.71 6.06 5.55
Bacillus 21.95 25.71 12.12 19.93
Proteus 9.75 8.57 – 6.10
Chromobacterium 9.75 5.71 3.03 6.16
Staphylococcus 12.19 5.71 12.12 10.00
Vibrio 2.43 5.71 – 2.71
Clostridium 4.87 5.71 6.06 5.55
Erwinia 2.43 5.71 3.03 3.72
Klebsiela 4.87 8.57 – 4.48
Alcaligens 4.87 – – 1.62
Clavibacter 2.43 5.71 6.06 4.73
Table 3 shows Shannon-Wiener and Margalef indices. The indices measure specie richness of a community independent of sample size. Bacteria species richness was most significant at location L1 and less significant at location L3. Location L1 has the highest number of bacteria species indicating highest species diversity. This means that location L1 has greater biological stability while location L3 has less biological stability.
Table 3: Species Diversity value of the bacteria species found in the snail farm
Diversity Indices L1 L2 L3(Control)
Taxas 12 11 8
Individuals 41 35 33
Dominance-D 0.3308 0.3306 0.3303
Shannon- H 1.993 1.991 1.843
Simpson 1-D 0.6695 0.6694 0.6697
Evenness e.H/S 0.864 0.868 0.886
Margalef 1.936 1.721 1.597
A total of twelve (12) distinct strains of bacteria were recorded from location L1 with Bacillus genera being the most dominant. The least genera were Vibrio, Erwinia and Clavibacter. In location L2 eleven (11) genera were recorded, Bacillus was the dominant genera. The total bacteria cultural types in location L3 were ten (8) genera. The genus Pseudomonas in location L3 was the most dominant(51.51), while Alcaligens, Klebsiela, Vibrio and proteus were not present. The total number of bacteria cultural types recorded were statistically significant (P<0.05) i.e., between Location L1 vs Location L2, Location L1 vs Location L3 and Location L2 vs Location L3.
In Table 4, Aspergillus has the highest abundance while the fungi specie with the lowest abundance was Trichoderma. This also did not exist in location L1 and L2 while fusarium was not recorded in location L3. A total of 126 individuals belonging to 10 genera were recorded in the study.
Table 4: Abundance of some fungi of the snail farm locations n x 103 (CFU/g)
Fungi L1 L2 L3 Total
Dichobotrys
7
8
– 15
Botrytis
4
3
4 11
Gonatobotrys
5
3
4 12
Fusarium
4
3
– 7
Trychoderma
2
–
1 2
Giotricum
2
2
1 5
Aspergillus
12
11
13 36
Phythopthora
6
10
8 24
Chrysosporium
–
2
1 3
Rhizopus
3
3
4 10
Total
45
45
36 126
Table 5: Relative abundance (%) of the fungi species within the snail farm
Fungi L1 L2 L3 MEAN
Dichobotrys 15.15 17.77 10.77
Botrytis 8.88 6.66 11.11 8.88
Gonatobotrys 11.11 6.66 11.11 9.63
Fusarium 8.88 6.66 – 5.18
Trychoderma 4.44 – 2.77 2.40
Giotricum 4.44 4.44 2.77 3.88
Aspergillus 26.66 24.44 3611 29.07
Phytopthera 13.33 22.22 22.22 19.26
Chrysosporium – 4.44 2.77 2.40
Rhizopus 6.66 6.66 11.11 8.14
DISCUSSION
The isolation of bacterial species from the soil showed that more microorganisms were observed in the snail farm soil L1 and L2 than L3. Of the 12 bacterial species observed in this study, four species were absent in the control soil samples unlike the snail farm soil samples which have more species. (Table 1.). The observation agrees with Parham et al (2003) and Reverodo and Melo (2007). The bacteria species were widely distributed except Alcaligens, Klebsiela, proteus and Vibrio, which did not show wide distribution in the three locations. Pseudomonas, Xantomonas, Bacillus, Chromobacterium, Staphilococcus, Clavibacter and Clostridium were all distributed in the three locations as shown in Table 1. This might be due to the presence of suitable habitat and breeding sites. Alcaligens was found only in location L1. Also, Vibrio was restricted to location L1 and L2 as shown in Table 1.
The highest number of bacteria was recorded in location L1 (12). This was followed by location L2 (11). The increased microbial prevalence in the snail farm soil samples indicates the increased microbial nutrient and conditions of bacterial growth. The high prevalence of micro-organism observed in location L1 and L2 agrees with Olaniya (2004). The snail waste could serve as increased additional source of microorganism in the soil. It could also be due to the heavy presence of leaf liters and more volumes of water in the location. This is also the location that recorded the lowest mortality. Sizable number of bacteria and fungi species were recorded in the three sites. Probably due to the dampness of the locations since the experiment was carried out at the peak of rain with relative air humidity near saturation which could be harmful to the snail in agreement with (Cobbinah et al 2008).
Bacillus was the most abundant species with the highest abundance recorded (28) during the study as shown in Table 2. Pseudomonas are the second most abundant species recorded. The highest numbers were recorded at location L3. There was no presence of Vibrio in location L3 and Alcaligens in location L2 and L3 as shown in Table 1.
Table 2 showed Baccillus as the specie with the highest relative abundance during the study. Staphylococcus are the second most abundant species recorded. Alcaligens have the lowest relative abundance.
Statistical analysis indicates that relative abundance between the locations were not significantly (P>0.05) different. Statistically there is no significant (P>0.05) difference between the species richness and diversity of the three locations. This may be attributed to the similar vegetation composition, climatic condition and soil condition of the sites. It may also be attributed to the sampling method used.
Shannon-Wiener and Margalef indices measures species richness of a community independent of sample size. Bacteria species richness was most significant at location L1 and less significant at location L3. Location L1 has the highest number of bacteria species indicating higher species diversity. (Table 3) This means that location L1 has greater biological stability while location L3 has less biological stability.
Sorenson quantitative index that was calculated showed that greater number of similar species are recorded at the location. This may be attributed to similarity in soil conditions like depth, size and vegetation cover.
In Table 4, Aspergillus in location L3 was the highest dominant specie(13) while the least dominant species were Trychoderma in location L2, Fusarium in location L3 and Chrysosprium in location L1. In Table 5, Aspergillus is the most dominant Fungi species (28.88) in location L3 while the least dominant species were giotricum (2.22) and Chrysosporium (2.22) in location l3. Aspergillus has the highest relative abundance (27.07). Variations of the relative abundance among the species in the habitat were not significantly different (P>0.05).
CONCLUSION
In conclusion, the season and time of the study which was at the peak of rain and other factors like over dampness of the farm could lead to increase in bacteria and fungi population.The prevalence and population of the various bacteria group could be used to assess soil fertility. Kazeev (2006) reported that many fertile soils have high microbial count.
A further study of bacteria and fungi species using more modern technology to obtain a detailed view of microbial diversity and using different sampling method is recommended as an extension of the investigation in the future.
References
Adesomoye, A O, Opere B O, and Makinde S C O (2006) Microbial content of abattoir waste
water and its contaminated soil in Lagos, Nigeria. African journal of Biotecnology. 5(20) 1963-1968.
Agbabiaka, T. O. and Oyeyiola G. (2012). Microbial and physiochemical assessment of Foma
River, Itanmo, Ilorin, Nigeria: an important source of domestic water in Ilorin metropolis. International journal of plant, animal and environmental sciences 2(1):209-216
Agbogodi O, and Okonta (2011) reducing poverty through snail farming in Nigeria. Agricultural
And biological journal. North America. 2(1): 169-172.
Akaninwor J. O., Anosike E. O, and Egwin O. (2007). Effect of indomie industry effluent
discharge on microbial properties of new calabar river. Scientific research and essay.2 (1): 001-005.
Akinnusi O. (2004) Introduction to snail and snail farming. Second edition. Published by Triolas
Exquisite Ventures, Abeokuta, Ibadan Road camp, Abeokuta, Nigeria.
Akpor O B, Okoh A I and Babalola G O (2006) Cultural microbial population dynamic
Decomposition of Theobroma cacao leaf litters in a tropical soil setting J. Bio.
Sci. 6 (4): 768-774.
Alikwe P C N, Okpeku M and Ndukari S (2013) Response of giant African land snail
(Archachatina marginata) to graded levels of asplenium bateri leaf meal supplement. Journal Of Agriculture and veterinary science 6(1):32-35
Bergey, B, and Dallinger R (1993). Terrestrial Snail as quantitative indicator of environmental
Pollution. Environ. Monit. Assess. 25:65-85
Duncan, D. B. (1995) Multiple Range and Multiple F test. A Biometric Approach, 11:1-42.
Dupont-Nivet M, Coste V, Common P, Bonnet J C and Blanc J M (2000) rearing density effect
on Production performance of edible land snail in indoor rearing. Journal of zoology 49(5): 447-456.
Ekundayo E O, (2005) Microbial flora association with the soils of edible land snail farms in
Souther nigeria. Nigerian journal of soil science 15:75-80.
Ezeronnye O U and Ubaka A O (2005) Studies on the effect of Abattoirs and industrial effluents
On heavy metal and the microbial quality of abattoirs in Nigeria. African journal of
Biotech.4(3): 266-272.
Fawole M. O. and Oso B, A. (2001). Laboratory Manuel of microbiology. Spectrum Books
Limited.
Ibom l A, Okon, B, and Bassey B E (2012) Egg traits, hatchabillty and survivability of black
Skin skimmed white skinned and cross bred Archachatina marginata snails. International Journal of agricultural science and bioresource engineering research 1: 10-18.
Kazeev K S (2006) Using of bioindicators in soil ecological researchs. 18th world congress of
Soil science. July. 9-15 Philadelphia, Pennsylvania, USA.
Nyoagbe I A, Appiah V, Tarbiri J N, Larbi D, and Adjei I (2016) Evaluation of African giant
snail (Achatina and Archachatina) obtained from markets (wild) and breeding farms
African journal of food science 10(7): 94-104.
Obasohan, E. E. Agbolahor D E, and Obanor E. E. (2010). Water pollution: a review of microbial
quality and health concerns of water, sediments and fish in the aquatic ecosystem. Africa Journal of Biotechnology, 9(4):425-427
Okon B, Ibom l A, Ebenso E A, and Bassey A E (2013) Developmental stages and quality traits
of Giant African land Snails (Archachatina marginata) eggs. Scientific research.
An Academic Publisher 5(10): 1121-1126
Ojokoh A. O. and Adetuyi, F. C. (2002). Bacteriological analysis of some water suplies in Mojere,
Akure, Nigeria. Journal of Microbiology 16(1/2):95-97.
Olaniya T (2004) Snail farming national agricultural digest 3, 18: 10-11
Parham J A, Deng S P, Raun W R, and Johnson G V, (2003) Long term cattle manure
application in soil 1 and 11. Effect on soil microbial population and community structure
Biol Fertl. 35: 328-337.
Pritchard, M., Mkandawire T. O. and Neil J. G. (2007) Biological, Chemical and physical drinking
water quality from shallow wells in Malawi: a case study of Blantyre, Chiradzulu and Mulanje. hys. Chem. Earth arts 32:1167-1177.
Reverodo M D, and Melo W J, (2007) Enzyme Activity and Microbial biomass in an Oxisol
Amended with Sewage Sludge conterminated with Nickel sci. Agric 64(1): 61-67
Seely H, W and VanDemark P J (1981). Microbes in Action- A laboratory Manual of
Microbiology, Freeman and Company, San Francisco, USA, P. 388.
Sridhar V, Jayashankar M, Vinesh I S and Verghese A (2012) Sever occurrence of the Africa
Land snail achatina fulica in Kolar District. Kamataka Pest Management in Horticultural Ecosystem 18: 228-230.
Ujowudu, C O, Kalu F. N., Nwaoguike R N., Kalu O. I., Ihejirika C. E. Nwosunjoku E. C. and
Okechukwu R. I. (2011) Biochemical and physical Characterization of diesel petroleum contaminated soil in South East Nigeria. Research Journal of Chemical Sciences 1(18):57-62
Uzoigwe C. I. and Agwa O. K. (2012). Microbiological quality of water collected from boreholes
sited near refuse dumpsites in ort Harcourt, Nigeria. Africa Journal of Biotechnology 11(13):3135-3139.
Willey J M, Sherwood I M and Woolverton C J, (2011) Pescotts Microbiology, 8th edition
Roman Zao (Zakharchenko) Artist, tattoo artist, researcher in visual culture Judge of international tattoo conventions Author of scholarly and research publications in tattoo art and body art United States EMAIL: Roman.Zao.ink@gmail.com ORCID: 0009-0003-5561-6339
UDC 7.036:391.91
Publication Date: 14 January 2026 Keywords: visual-corrective tattooing, body geometry, composition, body art, anatomy, visual perception, spatial correction, practice-based research
In contemporary tattoo practice, the visual-corrective function of imagery has become increasingly significant. Within this context, tattooing is considered not only as a decorative or symbolic element, but also as a tool for visual transformation of bodily form. Compositional decisions in tattoo art can enhance, soften, or reinterpret the geometry of the human body, making bodily structure a key factor in artistic choice.
Body geometry comprises a set of proportions, directions, curvatures, rhythms, and visual accents shaped by the anatomical structure of a specific body. Visual perception of the human figure is based not on objective anatomical parameters, but on their optical interpretation. In this context, tattooing may function as a visual-corrective instrument, working with the perception of form, direction, and balance.
Visual-corrective tattooing involves a conscious approach to line, scale, compositional direction, and rhythmic structure. Artistic decisions are developed with consideration of the body’s vertical, horizontal, and diagonal axes, as well as zones of visual tension and relaxation. Composition may reinforce verticality, soften abrupt transitions of form, balance asymmetry, or deliberately accentuate particular bodily features.
Practice-based analysis demonstrates that line is one of the key instruments of visual correction. Vertically oriented elements visually elongate the form; diagonal lines introduce dynamics and a sense of movement; horizontal structures may stabilize composition, yet if applied incorrectly, they can visually weigh down the figure. Thus, the directional choice of line within tattoo composition directly affects the optical perception of body geometry.
Scale is another significant factor. Large-scale compositions enable redistribution of visual emphasis and the formation of a new bodily rhythm, whereas fragmented solutions operate locally, correcting specific areas. Visual-corrective tattooing cannot be universal in application; its effectiveness depends on precise alignment between composition and the individual bodily structure.
Equally important is the interaction between tattoo imagery and the body’s natural curves and curvature. Placement that ignores curvilinear surfaces results in proportional distortion and diminished visual coherence. Conversely, integrating composition into bodily curvature achieves organic fusion, in which the tattoo is perceived as a continuation of the body rather than an applied surface element.
To systematize visual-corrective factors and their influence on compositional decision-making, the following analytical table is presented.
Table 1. Body Geometry Influence on Visual-Corrective Tattoo Composition
Body geometry factor
Visual perception issue
Corrective compositional approach
Expected visual effect
Vertical imbalance
Compressed silhouette
Vertical line dominance
Elongated body perception
Asymmetry
Visual instability
Directional flow alignment
Balanced visual structure
Excess curvature
Distorted proportions
Adaptive curvature mapping
Harmonized form perception
Volume concentration
Visual heaviness
Scale redistribution
Visual lightness
Irregular surface
Fragmented perception
Modular composition
Visual coherence
For more precise analysis of visual-corrective tattooing, the following system of notational markers is applied within the study.
Notation system (used in analytical observation) V-axis — dominant vertical orientation of composition H-axis — dominant horizontal orientation D-axis — diagonal compositional direction C-curve — curvature alignment with body surface S-scale — relative scale of tattoo composition F-flow — directional visual flow of elements
This notation system allows for documentation and comparison of compositional solutions across different cases, revealing correlations between body geometry and the visual effect of tattooing.
Analysis of accumulated practical and research material indicates that visual-corrective tattooing constitutes a complex form of spatial design in which artistic decision-making extends beyond imagery itself. In this context, the tattoo artist functions not only as a creator of visual form, but also as an interpreter of bodily structure, working with perception and optical transformation.
Thus, the influence of body geometry on the composition of visual-corrective tattooing is systemic in nature. Conscious integration of anatomical and geometric factors enables tattooing to be understood as an instrument of visual body modeling situated at the intersection of art, anatomy, and visual culture. Further research in this field opens pathways for deeper understanding of tattoo art as a form of spatial and perceptual artistic expression.
References
DeMello, M. (2014). Inked: Tattoos and Body Art around the World. Santa Barbara: ABC-CLIO. Featherstone, M. (2010). Body, image and affect in consumer culture. Body & Society, 16(1), 193–221. Pitts-Taylor, V. (2016). The Brain’s Body: Neuroscience and Corporeal Politics. Durham: Duke University Press. Sweetman, P. (2004). Anchoring the (postmodern) self? Body modification, fashion and identity. Body & Society, 10(2–3), 51–76. Jones, C. A. (2011). Body Art/Performing the Subject. Minneapolis: University of Minnesota Press. Sanders, C. R., & Vail, D. A. (2008). Customizing the Body: The Art and Culture of Tattooing. Philadelphia: Temple University Press. Braidotti, R. (2013). The Posthuman. Cambridge: Polity Press. Pitts, V. (2003). In the Flesh: The Cultural Politics of Body Modification. New York: Palgrave Macmillan.
Roman Zao (Zakharchenko) Independent artist-researcher in visual culture and tattoo art Master of Fine Arts (Graphic Design), Far Eastern Federal University Judge of international tattoo conventions Author of scholarly and research publications in tattoo art and visual culture United States EMAIL: Roman.Zao.ink@gmail.com ORCID: 0009-0003-5561-6339
UDC 7.036:391.91
Publication Date: 14 January 2026
Keywords: tattoo art, human anatomy, corporeality, visual culture, composition, body art, artistic decision-making, practice-based research
Tattoo art represents a distinct form of contemporary artistic practice in which the image is inseparable from the human body and cannot be examined outside its anatomical, spatial, and dynamic characteristics. Unlike traditional visual arts oriented toward a flat surface or a static volume, tattooing exists within the context of a living, constantly changing corporeal structure. This condition determines the central role of human anatomy in shaping artistic decision-making in tattoo art.
Contemporary research in body studies, visual studies, and body art emphasizes that the human body is not a neutral carrier of imagery. On the contrary, it functions as an active medium that influences composition, scale, rhythm, and the visual perception of an artistic image. Within the framework of this study, anatomy is considered a structuring factor of artistic decision-making rather than a secondary limitation of the creative process.
In tattoo art, the body constitutes a three-dimensional, dynamic form characterized by individual geometry, plasticity, and kinematics. Muscle masses, joint areas, natural curves, and transitional forms create a complex relief that inevitably interacts with the image. Artistic decision-making in tattooing emerges through a dialogue between the author’s concept and the anatomical features of a specific body. As a result, the same image transferred onto different bodies acquires distinct visual and semantic qualities.
Analysis of practical material and existing research demonstrates that neglecting anatomical factors leads to a loss of artistic integrity in tattoo imagery. Images created without regard for bodily geometry lose expressiveness in motion, deform with changes in body position, and enter into visual conflict with natural bodily lines. Conversely, integrating anatomical considerations into artistic decision-making enables the creation of images that maintain coherence and expressiveness both in static and dynamic states.
Of particular importance in tattoo art is work with areas of bodily mobility. Joints, shoulder and hip regions, and the spinal area require specific compositional approaches, as images in these zones are inevitably involved in movement. In such cases, artistic decisions are constructed with consideration not only of form but also of potential bodily kinetics. This brings tattoo art closer to principles of kinetic and performative art, in which movement constitutes an integral component of the artistic image.
Anatomy also directly affects the scale and rhythmic structure of composition. Large muscular surfaces allow for expanded forms and complex compositional structures, whereas anatomically complex areas demand more modular and fragmented solutions. In this context, the artistic thinking of the tattoo artist involves spatial modeling comparable to approaches used in sculpture and architecture.
For a clearer representation of the influence of anatomical factors on artistic decision-making in tattoo art, a comparative analytical overview is presented below.
Table 1. Influence of Human Anatomy on Artistic Decision-Making in Tattoo Art
Anatomical factor
Artistic implication
Compositional strategy
Visual outcome
Muscle volume and relief
Distortion or enhancement of form
Alignment with muscle flow
Increased visual coherence
Joint mobility
Image deformation during movement
Dynamic or segmented composition
Preserved readability in motion
Body curvature
Altered perspective
Adaptive scaling and curvature mapping
Natural visual integration
Skin tension zones
Line instability
Controlled line direction
Structural stability of image
Individual body proportions
Scale imbalance
Personalized compositional layout
Harmonized body–image relationship
As the analysis demonstrates, artistic decision-making in tattoo art is formed through a complex consideration of anatomical factors. Body anatomy not only influences the technical execution of imagery but also becomes an active participant in the artistic process, shaping the visual logic and expressive capacity of the tattoo image.
Viewing anatomy as an artistic factor allows for a reconsideration of authorship in tattoo art. Artistic decisions do not arise from the transfer of a preexisting image onto the body but rather from the interaction between the author’s concept and the corporeal reality of a specific individual. In this sense, the body functions as a co-author of the artistic image, fundamentally distinguishing tattooing from most traditional forms of visual art.
Thus, human anatomy constitutes a foundational factor in artistic decision-making in tattoo art. Recognizing the body as an active artistic medium enables tattooing to be understood as a complex interdisciplinary practice situated at the intersection of art, anatomy, visual culture, and corporeality. Further investigation of this interaction is essential for a deeper understanding of tattoo art as a form of contemporary artistic expression.
References
Pitts, V. (2003). In the Flesh: The Cultural Politics of Body Modification. New York: Palgrave Macmillan. Featherstone, M. (2010). Body, image and affect in consumer culture. Body & Society, 16(1), 193–221. DeMello, M. (2014). Inked: Tattoos and Body Art around the World. Santa Barbara: ABC-CLIO. Sanders, C. R., & Vail, D. A. (2008). Customizing the Body: The Art and Culture of Tattooing. Philadelphia: Temple University Press. Sweetman, P. (2004). Anchoring the (postmodern) self? Body modification, fashion and identity. Body & Society, 10(2–3), 51–76. Irwin, K. (2001/2003). Legitimating the first tattoo: Moral passage through informal interaction. Symbolic Interaction, 24(1), 49–73. Jones, C. A. (2011). Body Art/Performing the Subject. Minneapolis: University of Minnesota Press. MacCormack, P. (2008). The Anatomy of Disgust. New York: Continuum. Braidotti, R. (2013). The Posthuman. Cambridge: Polity Press. Pitts-Taylor, V. (2016). The Brain’s Body: Neuroscience and Corporeal Politics. Durham: Duke University Press.
Oral options for type 2 diabetes are changing how people manage blood sugar. Rybelsus is one such option that works through a hormone pathway and supports day-to-day glucose control. This guide explains what to expect, how to use it well, and ways to reduce common challenges.
For context about formulation and dosing strengths, reviewRybelsus Semaglutide Pills to understand how the tablet is designed and taken on an empty stomach. The information below focuses on practical steps, symptom patterns, and safety considerations in everyday life.
How this oral GLP-1 option works in the body
This medicine acts like GLP-1, a gut hormone that helps regulate glucose. It signals the pancreas to release insulin when blood sugar rises and reduces excess sugar made by the liver. It also slows stomach emptying slightly, which may help with appetite and post-meal spikes.
Why this mechanism matters
People often notice steadier fasting levels and fewer late-day highs. Some experience reduced hunger, which can support gradual weight changes. Results vary, and benefits build over weeks as the body adjusts.
Who may consider it
Adults with type 2 diabetes who need better A1C control despite diet and exercise may be candidates. It is not for type 1 diabetes or diabetic ketoacidosis. A clinician will factor in kidney function, gastrointestinal history, and personal goals before prescribing.
Symptoms, goals, and everyday challenges
High blood sugar can cause thirst, frequent urination, fatigue, and blurry vision. Over time, chronic highs raise risks for heart, kidney, eye, and nerve complications. The aim is consistent, safe targets while maintaining energy and preventing lows.
Setting realistic targets
Tracking fasting and post-meal readings helps spot patterns. Many people start with small, achievable goals such as trimming a 20–30 mg/dL rise after meals. Discuss personal targets and A1C goals with your clinician, especially if you have other conditions.
Recognizing early signals of change
During the first weeks, you may see smoother mornings or fewer sugar spikes after larger meals. Appetite may shift, making smaller portions feel sufficient. Keep a simple log of meals, doses, and symptoms to guide adjustments.
Getting started safely: timing, dosing, and interactions
Oral GLP-1 therapy is sensitive to timing and stomach conditions. The tablet is typically taken on an empty stomach with a small amount of water, followed by a wait period before eating, drinking, or taking other medications. Consistency at the same time each day helps absorption and outcomes.
Baseline checks and medical history
Before starting, clinicians often review kidney function, gastrointestinal history, and risk factors such as pancreatitis. Share all medications and supplements, including over-the-counter products. Mention any prior gallbladder issues, thyroid concerns, or severe reflux.
Other medicines and low-sugar risk
On its own, a GLP-1 usually has a low risk of hypoglycemia (low blood sugar). However, when used with insulin or sulfonylureas, lows can occur. Know symptoms like shakiness, sweating, or confusion, and carry fast-acting carbs if your regimen includes a low-risk medicine paired with a higher-risk one.
Class context and options
These therapies are part of a broader group that target the GLP-1 pathway. For a general overview of the class, seeGLP-1 Agonists and discuss with your clinician how the oral form compares with injections for your needs.
Managing common side effects and staying consistent
Most side effects are gastrointestinal and tend to be mild to moderate. Nausea, fullness, burping, or softer stools are common during dose changes. They often improve within two to eight weeks as your body adapts.
Ways to reduce nausea and reflux
Eat smaller, more frequent meals instead of large portions.
Favor bland foods early on; limit very spicy or greasy meals.
Sip water slowly; avoid chugging liquids around meals.
Wait the recommended time after dosing before eating or drinking.
Reduce carbonated beverages if bloating is bothersome.
If symptoms persist
Track what triggers discomfort and share specifics with your clinician. Slowing the dose increase or pausing escalation can help. Seek urgent care for severe abdominal pain, persistent vomiting, signs of dehydration, or yellowing of the skin or eyes.
Protecting hydration and digestion
Because this class can slow stomach emptying, hydration matters. Aim for consistent fluids across the day, especially in hot weather or during exercise. Include fiber from vegetables, legumes, and whole grains to support regularity.
Nutrition, activity, and daily routines that reinforce progress
Medication works best when paired with simple habits. Consistent meals, movement, and sleep can sharpen your response and reduce swings. Small, repeatable steps often outperform drastic short-term changes.
Meal planning and portion balance
Build plates around non-starchy vegetables, lean proteins, and healthy fats.
Choose high-fiber carbohydrates like beans, oats, and berries.
Watch added sugars in drinks, sauces, and snacks.
Use a consistent breakfast, especially important with a morning tablet routine.
Movement that fits your life
Even short walks after meals can reduce post-meal spikes. Aim for regular aerobic activity and two sessions of resistance training weekly, as tolerated. If activity raises low-sugar concerns with other medicines, plan a small carb snack and test more often.
Sleep, stress, and alcohol
Short sleep and high stress can raise glucose. Create a bedtime routine and practice brief stress breaks during the day. If you drink alcohol, monitor sugars more closely and avoid drinking on an empty stomach.
Monitoring progress and knowing when to adjust
Regular reviews help you and your clinician decide on dose changes. Many people see early shifts within four to eight weeks, with larger A1C changes over several months. Labs and home readings together give the clearest picture.
What to track weekly
Fasting glucose at least a few mornings per week.
One or two post-meal checks at varying meals.
Side effects, appetite changes, and hydration.
Body weight trends, if weight is a goal.
When readings are off target
Consider meal timing, missed doses, illness, or new medicines. Review tablet timing and the wait period to protect absorption. Bring your log to appointments so your clinician can tailor next steps.
Safety signals to discuss promptly
Contact a clinician for ongoing severe GI symptoms, signs of dehydration, or unexplained abdominal pain. Sudden worsening of glucose with illness warrants closer monitoring. If you become pregnant or plan to conceive, review your treatment plan.
Some people explore cross-border options for cost or access and consider Canadian pharmacies that ship to the United States. If comparing sources, confirm licensure and dispensing standards, and discuss any changes with your clinician beforehand.
Medical disclaimer: This content is for informational purposes only and is not a substitute for professional medical advice.
For site-wide education and resources on diabetes care, visitCanadianInsulin for general information and articles focused on condition management.