Ibrahim, A. D., & Umoru, K. (2026). Spatiotemporal Mapping and Analysis of the Land Use and Land Cover in Makurdi, Nigeria. International Journal of Research, 13(1), 278–286. https://doi.org/10.26643/ijr/2026/6


Abakpa David Ibrahim1, Kebiru Umoru2*
1University Library, University of Abuja, Nigeria
2National Centre for Remote Sensing, Jos, Nigeria
Correspondence: t.omali@yahoo.com
Abstract
This study employed geospatial techniques to capture the process of land conversion taking place. The objectives include mapping the land use types. The methodology involved geospatial technique which uses remote sensing and GIS techniques to identify the past and current condition of land use change occasioned development activities in the Makurdi Metropolis for the period of 1999, 2009 and 2019. The result shows that overall, there was progressive and increasing change in built-up area and water body categories, at (17.00%) and (1.73%) respectively during the period of study. However, vegetation cover, farm land, bare land and wetland decreased by (2.51%), (3.51%), (4.61%) and (8.08%) respectively. Residential buildings are fast encroaching the flood plain of River Benue in Makurdi. There is a need to sensitize the residents on the danger of flooding and provisions should be made to relocate those already occupying the location.
Keywords: GIS, land use change, Imagery, Mapping, remote sensing
- Introduction
The population of the world is growing at different rates relative to the total population (Omali, 2020), and it is becoming more urbanized (Enoch, John, and Jonathan, 2020). Changes in land use and land cover (LULC), which are more common in developing countries, are a result of this population growth. Due to the “push” of rural areas and the “pull” of urban centers, Nigeria’s high rate of urbanization is changing its land use (Aluko, 2013). Unprecedented alterations in the ecosystem and environmental processes have, of course, been brought about by natural forces and human activity (Okeke and Omali, 2016). This has resulted in a decline in biodiversity and environmental degradation. Land use and cover change is a global phenomenon. While urban centers are growing in population and area the surrounding open/agricultural lands are rapidly changing. Construction is putting increasing pressure on the land use to make room for a variety of urban land uses. There are severe consequences from the ruthless reduction of available land per person, including low or decreased food production, ecological degradation, environmental problems, and socioeconomic difficulties.
Current methods for managing natural resources and keeping an eye on environmental changes heavily rely on studies on changes in land use and land cover (LULC) (Okeke and Omali, 2016). This makes it feasible to comprehend human interactions with natural resources, both past and present, as well as their effects. To get the desired outcome, the conventional approach to LULC assessment is inadequate (Okeke and Omali, 2018). Therefore, it’s critical to use cutting-edge technologies, such as sophisticated computers, remote sensing, geographic information systems (GIS), GPS, and the power of spatial information systems (Okeke and Omali, 2016). Since remote sensing is the only affordable technology that provides data on a global scale, it provides an important means of detecting and analyzing spatiotemporal dynamics on geographical entities (Omali, 2018a). Through the use of aerial or spaceborne sensors, remote sensing gathers data about Earth without requiring the sensors to come into direct physical contact with the target or object of interest (Omali, 2022a). According to Omali (2021) the electromagnetic radiation serves as the transmission medium for information. GIS is typically employed in the gathering, storing, modifying, analyzing, visualizing, and presenting of georeferenced data and information (Omali, 2022b). Through the manipulation, analysis, statistical application, and modeling of spatial data, it provides us with the ability to handle spatially referenced data (Omali, 2022c). In general, remote sensing data and GIS techniques have emerged as incredibly helpful tools for mapping natural resources, such as vegetation and changes in land use/cover over geographic areas. This has allowed for the removal of many of the constraints associated with traditional surveying techniques and the acquisition of a continuous and comprehensive ecosystem inventory. In light of this, research on the LULC in Makurdi was conducted using geospatial technologies over a 20-year period, from 2009 to 2019.
- Methodology
- Data
Both primary and secondary sources provided data for the study; some of these are listed in Tables 1a and 1b. Satellite imagery and field observations make up the main sources. During the field campaign, training site coordinates were recorded using a handheld GPS device (Garmin Etrex 32). With the GPS using satellite, almost anywhere on Earth can be located at any time (Omali, 2023a). Furthermore, it is important to note that time-series data, such as remotely sensed data from various eras, must be applied in order to study and monitor LULC (Omali, 2023b). As a result, the time-series satellite data from three epochs of multi-spectral Landsat TM/ETM/OLI imagery were used in this study. Other materials such as newspapers, journals, textbooks, World Bank publications, and maps are included in the secondary sources.
Table 1a: Maps used in the study
| Type | Date of Production | Source | Scale | |
| Landuse/landcover map | Secondary | 1999 | Military Air Force Base Makurd | 1:1000000 |
| A base map of Makurdi LGA | Secondary | 2019 | Benue State Ministry of Land and Survey | 1:50000 |
Table 1b: Satellite imageries used in the study
| Type | Path/Row | Date of Imagery | Source | Resolution | |
| TM (Band 1-7) | Primary | 188/55 | July 5, 1999 | Global Land Cover Facility (GLCF) database. | 30m |
| ETM+(Band 1-7) | Primary | 188/55 | August 4, 2009 | Global Land Cover Facility (GLCF) database. | 30m |
| OLI+ | Primary | 188/55 | July11, 2019 | Global Land Cover Facility (GLCF) database. | 30m |
- Pre-processing of the Satellite Imagery
It is crucial to pre-process satellite images for accurate change detection (Andualem et al., 2018). Time series analysis requires this crucial step in order to reduce noise and improve the interpretability of image data (Yichun et al., 2008). The processes and methods used in satellite image processing include geometric correction, atmospheric and radiometric correction, and masking study areas. To produce a consistent and trustworthy image database, radiometric and atmospheric correction is applied to account for variations in the viewing geometry and instrument response characteristics, as well as atmospheric conditions related to scene illumination. Pre-processing techniques used in this study included study area masking, image enhancement, and correction for atmospheric and radiometric errors. In order to bring the image scene and the scanned topographic maps into the same coordinate system, they were also co-registered into UTM zone 32N, WGS 84.
- Image Classification
The goal of the imagery classification process was to assign each pixel in the digital image to one of many land cover classes, or “themes” (Omali, 2018b). This allows for the creation of thematic maps of the land cover present in an image. Finding the land use and land cover class of interest was the first stage in this study’s mapping and change analysis of land use and land cover. In this investigation, we employed six classes, as indicated in table 2, by incorporating and adapting the classification scheme from Andersen et al. (1971). The classes listed in Table 2 were utilized in this study. Also, the maximum likelihood supervised classification technique was used to classify LULC images from Landsat data. The study’s training sites were first located and defined. Fieldwork yielded training samples in line with Lu and Weng (2007). For the actual supervised classification of the study area, signature files containing statistical data about the reflectance values of the pixels within the training site for each of the LULC types or classes were developed in line Ojigi (2006). The supervised classification algorithm was imputed with the signatures.
Table 2: Land Use/Land Cover Classification Scheme
| Land Use | Description |
| Built-up Area | comprises all developed surfaces including residential, commercial, industrial complexes, public and private institutions, recreational areas, Airport, Factories, Interstate highways, roads networks that linked most of the areas together. |
| Vegetation, | areas covered with plants of various species. This category includes grassland and non-agricultural trees and shrubs they are mostly wild plants. |
| Farm Land, | land used primarily for cultivation of food and fibre, it includes cropped areas, fallow land and plantations (Ochards, nursery, vineyard etc.), harvested areas and herbaceous croplands. |
| Bare Surface, | includes open surfaces, rocky outcrops, sandy area, strip mines, quarries, gravel pits, silt etc. Exposed soil devoid of vegetal cover, that is, open spaces. |
| Water body, | includes areas covered with water bodies such as rivers, streams, lakes, flood plain, Reservoirs. It also includes artificial impoundment of water like dam used for irrigation, flood control, municipal water supplies, recreation, etc. |
| Wetland. | an area where water covers the soil either at or near the surface of the soil all year or for varying periods of time during the year, including during the growing season. |
Source: Adapted and modified from Anderson et al., (1971)
- Land Use and Land Cover change Detection
There are numerous approaches for detecting changes in multi-spectral image data, such as time series analysis, vector analysis of spectral changes, and characteristic analysis of spectral type. Time series analysis is the most common method, and it was used in this study. Its objective is to analyze the course and trend of changes by tracking ground objects using continuous observation data from remote sensing (Adzandeh, et al., 2014). Naturally, post-classification comparisons can yield results of change that are acceptable and provide “from-to” data (Okeke and Omali, 2018).
- Results and Discussion
- Land Use and Land Cover Classification Result
The satellite imageries covering the study area were classified in GIS environment. Tables 2 reveal that there is a progressive and significant increase in built-up area which is necessitated by the increase in commercial activities, residential growth, economic and social activities. This is in line with the findings of Etim and Dukiya (2013) who opine that urban encroachment on agricultural land has reduced the productivity of most farmers in Makurdi. The water body recorded little increase due to the increase in water works like construction of Kaptai Lake, which is the largest artificial lake in the country. The farm land, vegetation, bare land and wetland decreases throughout the period of study.
Table 3: Land use and land cover distribution of Makurdi
| Class | 1999 | 2009 | 2019 | |||
| Area (km2) | (%) | Area (km2) | (%) | Area (km2) | (%) | |
| Built-up | 98.079 | 11.97 | 170.968 | 20.86 | 237.46 | 28.97 |
| Vegetation | 138.20 | 16.86 | 125.695 | 15.33 | 117.653 | 14.35 |
| Farm Land | 203.56 | 24.83 | 184.608 | 22.52 | 174.735 | 21.32 |
| Bare Land | 142.487 | 17.38 | 122.249 | 14.91 | 104.561 | 12.77 |
| Water Body | 22.459 | 02.74 | 29.164 | 03.56 | 36.658 | 04.47 |
| Wetland | 214.89 | 26.22 | 186.99 | 22.78 | 148.696 | 18.14 |
| Total | 819.670 | 100 | 819.670 | 100 | 819.670 | 100 |
The classified images (false colour composite) for the different periods 1999, 2009 and 2019 of study area are shown in Figures 5.1, 5.2 and 5.3 respectively. These colour composite shows the visual distribution pattern of the distribution and change taking place in the images of the areas throughout the period of study. The dominating land use and land cover category in 1999 as shown in Table 3 and figure 1 is the wetland covering an area of 214.89km2 (26.22%). This is understandable as Hemba, et al. (2017) describes the relief of Makurdi town as lying entirely in the low- laying flood Plain with River Benue forming the major drainage channel. Farm land covers 203.56km2 representing 24.83% of Makurdi.
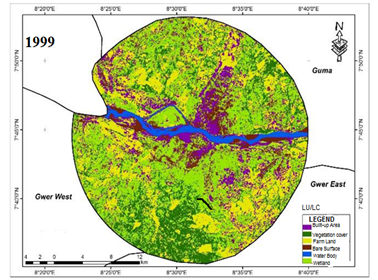
Figure 1: Land Use and Land Cover of Makurdi in 1999
Most residents engage in farming, either crop production or livestock farming as the soil is fertile and the weather is conducive for agricultural practices. This assertion supports the views of Hula, (2010) who noted that most farmers in Makurdi cultivate land for crop production, rearing of animals for consumption and selling part of the produce to generate money to meet other needs. The populace of Makurdi comprises of indigenous farmers and migrants who are mostly engaged in farm activities as noted by Oju et al. (2011). Due to farming and hunting and other activities like sand mining carried out in Makurdi, the size of bare land is observed to occupy large space of about 142.487km2 represented by 17.38% in 1999. This is because farmers have enough space to cultivate. Farmers relocate to other lands whenever a particular land becomes unproductive and this has been the major cause of bare land in the study area. These contradicts Tee (2019) who argued that hunting, grazing and other factors, which lead to clearing of land through manual, mechanical and chemical means have greatly changed the original vegetation cover to bare land and other classes of land use in Makurdi. The vegetation covered a reasonable size of land and it was 138.20km2 (16.86%).This is attributed to the few number of settlers in Maukurdi and low level of human activities taking place within the urban centre as at the time. The water body was 22.459 km2 (2.74%) with River Benue forming the major drainage system in the area and is the main source of water for human use. This is in line with the views of Nnule and Ujoh, (2017) who pointed out that Benue River is the main source of water in Makurdi. This doesn’t mean that other form of water sources like borehole, ponds and dams are not important.
Table 1 and figure 2 shows that the wetland had the largest area coverage of about 186.99km2 (22.78%) in 2009 as the entire land fall within the Benue Valley and Trough. The geology of the study area influence the wetland, this infect is also confirmed by Iorliam, (2014). The farmland occupies 184.608km2 (22.52%), as most residents are farmers. The number is significant as civil
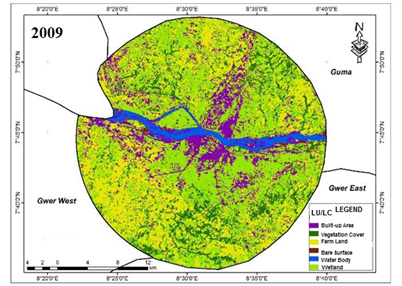
Figure 2: Land Use and Land Cover of Makurdi in 2009.
servants also own farms. The built-up, which was 170.968km2 (20.86%) recorded a high increase due the increase in population. This corroborates the findings of Jiang, et al. (2013) which stated that the urban expansion on agricultural land is associated with both shrinking agricultural land area and a higher level of urban development. It also agrees with the findings of Araya and Cabral (2010) that substantial growth of urban areas has occurred worldwide in the last few decades with population increase being one of the most obvious agents responsible. The vegetation cover depreciated to 125.695km2 (15.33%). This may be attributed to deforestation as more forest was cleared to provide more space for increasing human development. This is buttressed by Mugish and Nyandwi (2015) that housing development on arable farm land in most cities has become an issue on the global agenda in recent times. Bare land, which was 122.52km2 (14.91%) decreased as the spaces were being covered with more structures but the water body 29.164km2 (3.56%) slightly increased. Of course, this is an indication that most of the human activities use water and other sources of water are being developed to meet the need of the increasing populace.
The level of human activities in the year 2019 was very high, although Makurdi has no functional Master Plan to check the developmental activities, however, as shown in the image Fig5.3 and Table5.1, The built-up area of 237.46km2 (28.97%) in 2019 almost tripled its size recorded in 1999.This supports the assertion by United Nations Department of Economy and Social Affairs (UNDESA, 2010) that urban cities have changed from small isolated population
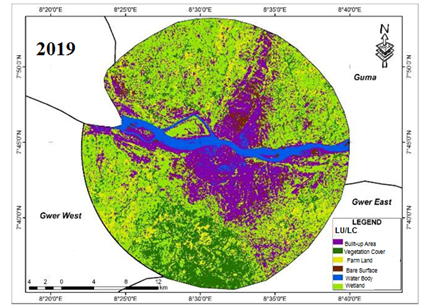
Figure 3: Land Use and Land Cover of Makurdi in 2019.
centres to large interconnected economic, physical, and environmental features. In recent time, issues of Herdsmen/Farmers crisis are among factors contributing to the migration of people from neighbouring villages to Makurdi Town for safety. These numbers of people who mostly settled along the urban hinterland, which is mostly used for agricultural purpose, have converted the land for building of houses and other socioeconomic infrastructures. The farm land occupies 174.735km2 (21.32%) as it decreases with population upsurge settles in the study area. Farmers move outside of Makurdi to get land for their activities which make the cost of cultivation expensive than expected. Agencies with the mandate of protecting natural ecosystem are weak in areas of law enforcement in Makurdi as infrastructural developments are indiscriminately carried out. This observation contradicts the views of Wade quoted in Nico et al. (2000) that Various NGOs, government and international Agencies have been supporting the urban agriculture (UA) since 1970s in major world regions. There was reduction in wetland to 148.696km2 (18.14%) and vegetation cover to 117.653km2 (14.35%) compared to the previous ten years while the water body 36.658km2(4.47%) increases during the same periods.
- Conclusion
The research findings revealed that built-up area increased all through the period of study while arable land decreases due to infrastructural development. The rapid increase in built-up area is because the surrounding agricultural land is fast decreasing. Bare land, vegetation and wetland decreased throughout the period of study as human settlement increases over the years. Of course, it was observed that the effect of the development was concentrated more to the north eastern part of Makurdi as residential buildings with high rate of economic activities is observed in the region. Generally, this study has been able to show that conversion of open/agricultural land for infrastructural development was mostly due to increase in number of people through migration and natural means of population growth. The land use and land cover change detection for the period of 20 years revealed the extent and type of conversion. The study recommends Green areas within and around the city should be properly preserved as this allows for ventilation. All effort should be put in place to prevent unofficial development and measures should be in place to curb population growth which has encouraged urban sprawl on prime agricultural land as this is feasible around Makurdi hinterland.
References
Aluko, O. (2011). Sustainable Housing Development and Functionality of Planning Laws in Nigeria: The case of Cosmopolitan Lagos. Journal of Sustainable Development, 4(5), 139–150.
Anderson, J. R. (1971). Land use classification schemes used in selected recent geographic applications of remote sensing: Photogramm. Eng., v. 37, no. 4, p. 379–387.
Adzandeh, E. A.; O. O. Fabiyi and Y. A. Bello. (2014). Statistical Analysis of Urban Growth in Kano Metropolis, Nigeria. International Journal of Environmental Monitoring and Analysis.2 (1): 50–56
Araya, Y. H. and Cabral, P. (2010). Analysis and Modeling of Urban Land Cover Change in Setúbal and Sesimbra, Portugal. Remote Sensing, 2: 1549–1563
Enoch, T. I.; T. S. John and I. A. Jonathan. (2020). Spatial Expansion of Urban Activities and Agricultural Land Encroachment in Makudi Metropolis: European Journal of Environment and Earth Science, 2684–446X
Etim, N. E. and J. J. Dukiya. (2013). GIS Analysis of Peri–Urban Agricultural Land Encroachment in (FCT), Nigeria. International Journal of Advanced Remote Sensing and GIS, 2(1): 303–315.
Hemba, S.; T. Enoch. l. Orimoleye and P. Dam. (2017). Analysis of the Physical Growth and Expansion of Makurdi Town. Imperial Journal of Interdisciplinary Research.3(4).
Hula, M. A. (2010). Population Dynamics and Vegetation Change in Benue State, Nigeria. Journal of Environmental Issues and Agriculture in Developing Countries, 2(1), pp53.
Iorliam, T. S. (2014). The Dialectics between Physical Plans and Physical Development in Contemporary Urban Nigeria: Empirical Evidence from the Kighir-Adeke Layout, Makurdi, Nigeria. Academic Research International Vol. 5(4).
Jiang, L; X. Deng and K. Seto. (2013). The Impact of Urban Expansion on Agricultural Land Use intensity in China. Land Use Policy, 35: 33–39.
Lu, D. and Q. Weng, (2007). A Survey of Image Classification Methods and Techniques for Improving Classification Performance. International Journal of Remote Sensing, vol. 28, pp. 823–870.
Mugish, J. and E. Nyandwi. (2015). Kigali City Peri-Urbanization and its Implications on Peri-Urban Land Use Dynamics: Cases of Muyumbu and Nyakaliro. GeoTechRwanda 2015– Kigali
Ojigi, L. M. (2006). Analysis of Spatial Variations of Abuja Land Use and Land Cover From Image Classification Algorithms,’’ ISPRS Commission VII Mid–Term Symposium, 8 – 11th May 2006, Enschede, The Netherlands (Conference proceedings).
Okeke, F. I. and T. U. Omali. (2016). Spatio-temporal Evaluation of Forest Reserves in the Eastern Region of Kogi State using Geospatial Technology. Tropical Environment, 13(1): 75–88.
Okeke, F. I., and T. U. Omali. (2018). Monitoring Deforestation and Forest Degradation in Yankari Games Reserve of Bauchi, Nigeria. Presentation at NIS AGM/Conference Bauchi, 2018. 18th June–22nd June, 2018
Omali, T. U. (2018a). Prospects of satellite–Enhanced Forest Monitoring for Nigeria. International Journal of Scientific & Engineering Research, 9(5), 383–388.
Omali, T. U. (2018b). Impacts of Sensor Spatial Resolution on Remote Sensing Image Classification. Global Scientific Journal, 6(1), 63–68.
Omali, T. U. (2020). Ecological Evaluation of Urban Heat Island Impacts in Abuja Municipal Area of FCT Abuja, Nigeria. World Academics Journal of Engineering Sciences, 7(1): 66–72.
Omali, T. U. (2021). Utilization of Remote Sensing and GIS in Geology and Mining. International Journal of Scientific Research in Multidisciplinary Studies, 7(4): 17–24.
Omali, T. U. (2022a). Monitoring the Ecological Component of Sustainable Development Goals using Geospatial Information Tools: A Review. International Journal of Scientific Research in Biological Sciences, 9(1): 92–99.
Omali, T. U. (2022b). Correlation of Geographic Information System with the Evolutionary Theory of Spatial Analysis. International Journal of Scientific Research in Computer Science and Engineering, 10(4): 18–22.
Omali, T. U. (2023a). Time-series Analysis of Vegetation Cover in the Southwest Nigeria using Remote Sensing and GIS. International Journal of Scientific Research in Multidisciplinary Studies, 8(7): 36–42.
Omali, T. U. (2023b). Coordinate Transformation of GPS Measurement Results using the Cartesian-to-Ellipsoidal Transformation System. International Journal of Scientific Research in Mathematical and Statistical Sciences, 10(4): 09–13.
Tee, N. T., P. U., Ancha, and J. Asue. (2019). Evaluation of Fuel Wood Consumption and Implications on the Environment: Case Study of Makurdi area in Benue state, Nigeria. Journal of Applied Biosciences, 19:1041–1048.
Yichun X., S. Zongyao, and Y., Mei. (2008). Remote Sensing Imagery in Vegetation Mapping: A Review. J Plant Ecol., 1(1): 9–23.

